Combination RSI & PPO%
Still in testing.
It also includes some candle pattern (candle closing higher/lower than 60% of the high/low).
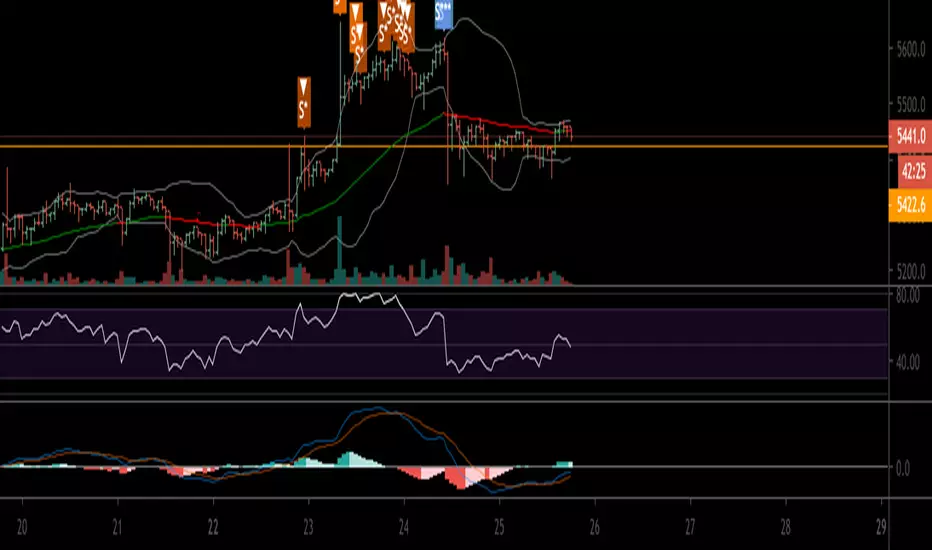
I have also added specific patterns observed on the 1H charts on XBTUSD (Bitmex). They may not work on other tickers!!! These signals are marked in blue and have three stars (***).
As a rule, they should be entered on the open of the next candle and closed on RSI going upper/lower than 70/30, respectively.
I will share the results of the strategies built on the two XBT-specific signals as they are quite powerful.
However, one always needs to put stop losses and understand the R/S levels.
I recommend exiting any trades taken based on the blue signals either within 5 candles from the signal or on the second breach of RSI above/below 70/30.
สคริปต์แบบเฉพาะผู้ได้รับเชิญเท่านั้น
เฉพาะผู้ใช้งานที่ผู้เขียนอนุมัตเท่านั้นจึงจะสามารถเข้าถึงสคริปต์นี้ได้ คุณจะต้องขอและได้รับอนุญาตก่อนใช้งาน ซึ่งโดยทั่วไปจะได้รับอนุญาตหลังจากชำระเงินแล้ว สำหรับรายละเอียดเพิ่มเติม โปรดทำตามคำแนะนำของผู้เขียนด้านล่าง หรือติดต่อ fastmoveforward โดยตรง
TradingView ไม่แนะนำให้จ่ายเงินหรือใช้สคริปต์ เว้นแต่คุณจะเชื่อถือผู้เขียนและเข้าใจวิธีการทำงานของสคริปต์นั้นอย่างถ่องแท้ คุณยังสามารถหาทางเลือกแบบโอเพนซอร์สฟรีได้ใน สคริปต์ชุมชนของเรา
คำแนะนำของผู้เขียน
คำจำกัดสิทธิ์ความรับผิดชอบ
สคริปต์แบบเฉพาะผู้ได้รับเชิญเท่านั้น
เฉพาะผู้ใช้งานที่ผู้เขียนอนุมัตเท่านั้นจึงจะสามารถเข้าถึงสคริปต์นี้ได้ คุณจะต้องขอและได้รับอนุญาตก่อนใช้งาน ซึ่งโดยทั่วไปจะได้รับอนุญาตหลังจากชำระเงินแล้ว สำหรับรายละเอียดเพิ่มเติม โปรดทำตามคำแนะนำของผู้เขียนด้านล่าง หรือติดต่อ fastmoveforward โดยตรง
TradingView ไม่แนะนำให้จ่ายเงินหรือใช้สคริปต์ เว้นแต่คุณจะเชื่อถือผู้เขียนและเข้าใจวิธีการทำงานของสคริปต์นั้นอย่างถ่องแท้ คุณยังสามารถหาทางเลือกแบบโอเพนซอร์สฟรีได้ใน สคริปต์ชุมชนของเรา