INVITE-ONLY SCRIPT
RSI Levels
ที่อัปเดต:
RSI Levels
- The relative strength index ( RSI ) is a technical indicator used in the analysis of financial markets.
It is intended to chart the current and historical strength or weakness of a stock or market based on the closing prices of a recent trading period.
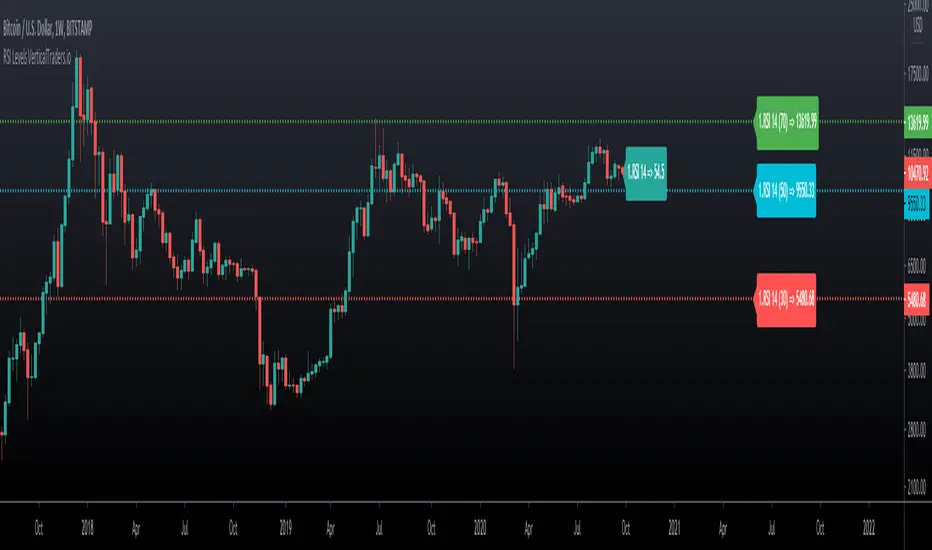
- This indicator allows us to visualize the levels of rsi in the chart, so that we can calculate take profit and stop points in a simple way,
knowing what position the price is currently in relation to these levels and how much space we have.
- We can also visualize the slope of the three levels of rsi , overbought, oversold and level 50, something that is not possible in the oscillator version.
- It allows you to display 2 rsi values at the same time.
- Allows to change the color of candlesticks based on rsi.

- The relative strength index ( RSI ) is a technical indicator used in the analysis of financial markets.
It is intended to chart the current and historical strength or weakness of a stock or market based on the closing prices of a recent trading period.
- This indicator allows us to visualize the levels of rsi in the chart, so that we can calculate take profit and stop points in a simple way,
knowing what position the price is currently in relation to these levels and how much space we have.
- We can also visualize the slope of the three levels of rsi , overbought, oversold and level 50, something that is not possible in the oscillator version.
- It allows you to display 2 rsi values at the same time.
- Allows to change the color of candlesticks based on rsi.
เอกสารเผยแพร่
V 2.0เอกสารเผยแพร่
V 2.1เอกสารเผยแพร่
V 2.2สคริปต์เฉพาะผู้ได้รับเชิญเท่านั้น
การเข้าถึงสคริปต์นี้จำกัดเฉพาะผู้ใช้ที่ได้รับอนุญาตจากผู้เขียน และมักจะต้องชำระเงินก่อน คุณสามารถเพิ่มลงในรายการโปรดของคุณได้ แต่คุณจะสามารถใช้งานได้หลังจากขออนุญาตและขอรับจากผู้เขียนเท่านั้น ติดต่อ Vertical-X สำหรับข้อมูลเพิ่มเติม หรือทำตามคำแนะนำของผู้เขียนด้านล่าง
TradingView ไม่แนะนำให้ชำระเงินสำหรับการซื้อสคริปต์และไม่แนะนำให้ใช้งานสคริปต์นั้นๆ จนกว่าคุณจะเชื่อมั่นในผู้เขียนสคริปต์ 100% และเข้าใจว่าสคริปต์ทำงานอย่างไร ในกรณีอื่นๆ คุณสามารถหาทางเลือกโอเพนซอร์สที่ดีได้ฟรีใน สคริปต์ชุมชน ของเรา
ต้องการที่จะใช้สคริปต์นี้บนชาร์ตใช่ไหม?
คำเตือน: กรุณาอ่าน ก่อนร้องขอการเข้าถึง
🔰 The Best Trading Indicators: links.verticaltraders.io
คำจำกัดสิทธิ์ความรับผิดชอบ
ข้อมูลและบทความไม่ได้มีวัตถุประสงค์เพื่อก่อให้เกิดกิจกรรมทางการเงิน, การลงทุน, การซื้อขาย, ข้อเสนอแนะ หรือคำแนะนำประเภทอื่น ๆ ที่ให้หรือรับรองโดย TradingView อ่านเพิ่มเติมที่ เงื่อนไขการใช้บริการ