OPEN-SOURCE SCRIPT
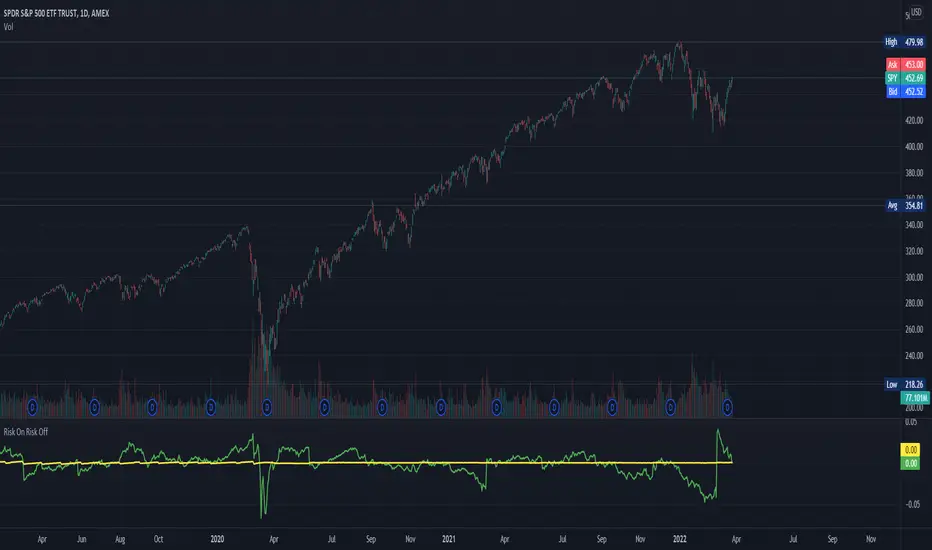
Risk On Risk Off

A helpful indicator for those who follow a systematic long-term investment approach.
What it shows:
It shows the 60 Day Cumulative Return of BND Vanguard Total Bond Market ETF against the 60 Day Cumulative Return of
  BIL SPDR Bloomberg Barclays 1-3 Month T-Bill ETF.
Why:
This Indicator will provide you a sense of where the economic environment is at, if the indicator shows that the 60 Day Cumulative return of BND is ABOVE
  BIL, it means that it's a good idea to go Risk ON in the stock market; On the other hand, if the inverse is true, it means that is a good idea to go Risk OFF in the stock market.
Example Uses:
Warren Buffet often advice Investors to just buy a S&P500 index tracking ETF like SPY consistently and you will likely to be making money in the long-term.
With this indicator you will be able to make the Buffet Strategy even simpler: when the indicator shows Risk ON, buy the SPY; when the indicator shows Risk OFF, consider hedges like
  IEF iShares 7-10 Year Treasury Bond ETF.
 SPY
SPY
What it shows:
It shows the 60 Day Cumulative Return of
Why:
This Indicator will provide you a sense of where the economic environment is at, if the indicator shows that the 60 Day Cumulative return of
Example Uses:
Warren Buffet often advice Investors to just buy a S&P500 index tracking ETF like
With this indicator you will be able to make the Buffet Strategy even simpler: when the indicator shows Risk ON, buy the
สคริปต์โอเพนซอร์ซ
ด้วยเจตนารมณ์หลักของ TradingView ผู้สร้างสคริปต์นี้ได้ทำให้เป็นโอเพนซอร์ส เพื่อให้เทรดเดอร์สามารถตรวจสอบและยืนยันฟังก์ชันการทำงานของมันได้ ขอชื่นชมผู้เขียน! แม้ว่าคุณจะใช้งานได้ฟรี แต่โปรดจำไว้ว่าการเผยแพร่โค้ดซ้ำจะต้องเป็นไปตาม กฎระเบียบการใช้งาน ของเรา
คำจำกัดสิทธิ์ความรับผิดชอบ
ข้อมูลและบทความไม่ได้มีวัตถุประสงค์เพื่อก่อให้เกิดกิจกรรมทางการเงิน, การลงทุน, การซื้อขาย, ข้อเสนอแนะ หรือคำแนะนำประเภทอื่น ๆ ที่ให้หรือรับรองโดย TradingView อ่านเพิ่มเติมใน ข้อกำหนดการใช้งาน