OPEN-SOURCE SCRIPT
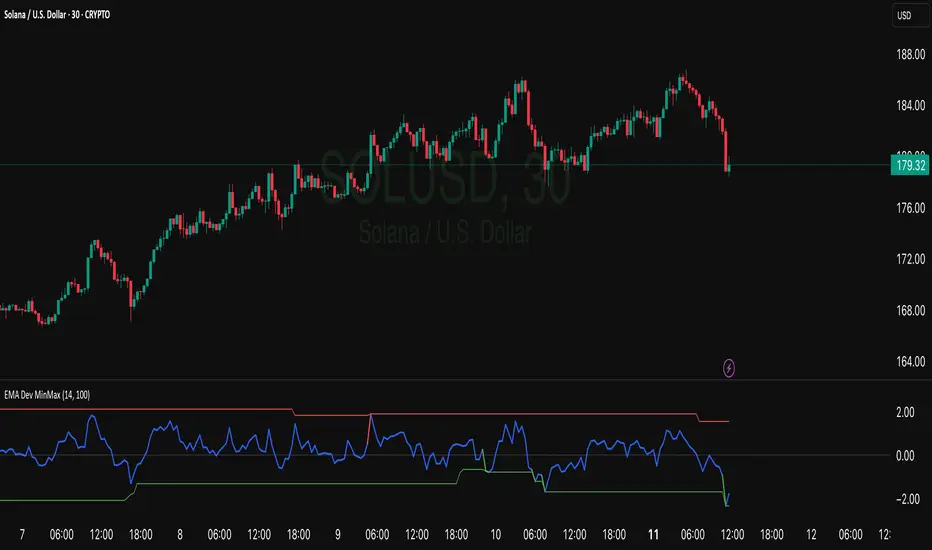
EMA Deviation with Min/Max Levels

his indicator visualizes the percentage deviation of the closing price from its Exponential Moving Average (EMA), helping traders identify overbought and oversold conditions. It dynamically tracks the minimum and maximum deviation levels over a user-defined lookback period, highlighting extreme zones with color-coded signals:
• 🔵 Normal deviation range
• 🔴 Near historical maximum — potential sell zone
• 🟢 Near historical minimum — potential buy zone
Use it to spot price extremes relative to trend and anticipate possible reversals or mean reversion setups.
• 🔵 Normal deviation range
• 🔴 Near historical maximum — potential sell zone
• 🟢 Near historical minimum — potential buy zone
Use it to spot price extremes relative to trend and anticipate possible reversals or mean reversion setups.
สคริปต์โอเพนซอร์ซ
ด้วยเจตนารมณ์หลักของ TradingView ผู้สร้างสคริปต์นี้ได้ทำให้เป็นโอเพนซอร์ส เพื่อให้เทรดเดอร์สามารถตรวจสอบและยืนยันฟังก์ชันการทำงานของมันได้ ขอชื่นชมผู้เขียน! แม้ว่าคุณจะใช้งานได้ฟรี แต่โปรดจำไว้ว่าการเผยแพร่โค้ดซ้ำจะต้องเป็นไปตาม กฎระเบียบการใช้งาน ของเรา
คำจำกัดสิทธิ์ความรับผิดชอบ
ข้อมูลและบทความไม่ได้มีวัตถุประสงค์เพื่อก่อให้เกิดกิจกรรมทางการเงิน, การลงทุน, การซื้อขาย, ข้อเสนอแนะ หรือคำแนะนำประเภทอื่น ๆ ที่ให้หรือรับรองโดย TradingView อ่านเพิ่มเติมใน ข้อกำหนดการใช้งาน