PROTECTED SOURCE SCRIPT
Realtime Order Bubbles — cryptomonk
Description:
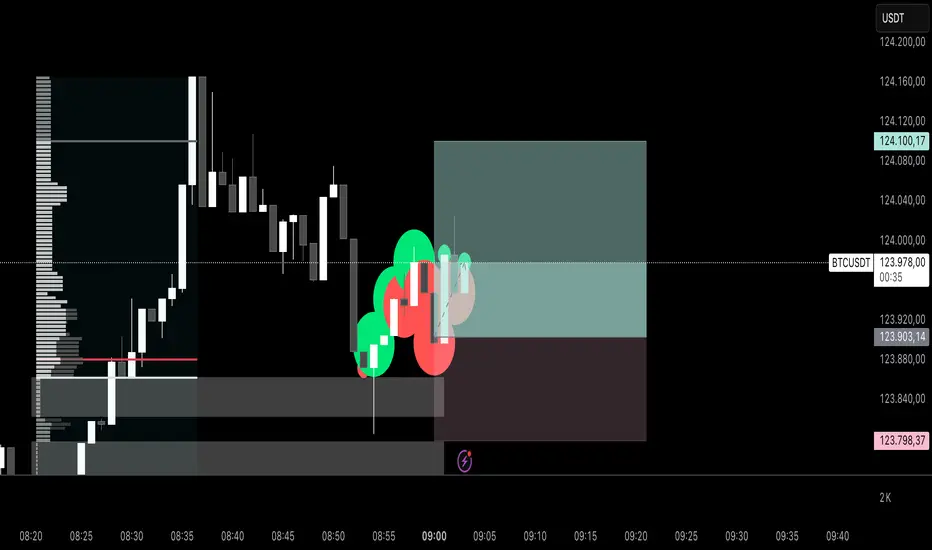
Displays real-time bubbles on the chart to visualize buy and sell activity within each candle.
• Green bubbles → Volume increase on upticks (buy pressure)
• Red bubbles → Volume increase on downticks (sell pressure)
• Bubble size → Strength of the volume change
How it works:
The indicator compares live tick updates (or bar closes) against previous volume and price values to detect whether a move was initiated by buyers or sellers, then plots bubbles in real-time accordingly.
Best used for:
• Scalping / Intraday analysis on lower timeframes (1–5 min)
• Detecting volume spikes, momentum shifts, and aggressive order flow
• Works best when chart is set to “Go Live” for tick-level updates
Use case:
A lightweight visual tool for identifying short-term order flow and understanding market pressure without needing full footprint data.
สคริปต์ที่ได้รับการป้องกัน
สคริปต์นี้ถูกเผยแพร่เป็นแบบ closed-source อย่างไรก็ตาม คุณสามารถใช้ได้อย่างอิสระและไม่มีข้อจำกัดใดๆ – เรียนรู้เพิ่มเติมได้ที่นี่
คำจำกัดสิทธิ์ความรับผิดชอบ
ข้อมูลและบทความไม่ได้มีวัตถุประสงค์เพื่อก่อให้เกิดกิจกรรมทางการเงิน, การลงทุน, การซื้อขาย, ข้อเสนอแนะ หรือคำแนะนำประเภทอื่น ๆ ที่ให้หรือรับรองโดย TradingView อ่านเพิ่มเติมใน ข้อกำหนดการใช้งาน