OPEN-SOURCE SCRIPT
Keltner Zones
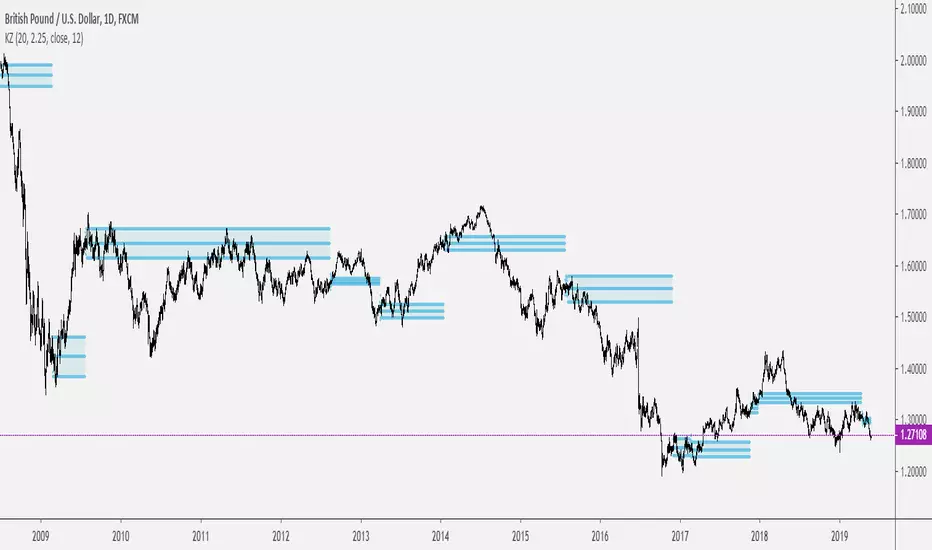
This is an indicator that draws support and resistance zones / levels based on price action in and around Keltner Channels.
There are 3 different modes;
You can also decide if you want the indicator to paint zones or levels. The Zones can grow rather large if there is a volatility shock since they are drawn using the true range around the trigger price.
Upper Band Zones

Lower Band Zones

Congestion Zone

There are 3 different modes;
- Draw zones based on price breaking the upper band
- Draw zones based on price breaking the lower band
- Draw zones if price stays within the bands for a prolonged period of time.
You can also decide if you want the indicator to paint zones or levels. The Zones can grow rather large if there is a volatility shock since they are drawn using the true range around the trigger price.
Upper Band Zones
Lower Band Zones
Congestion Zone
สคริปต์โอเพนซอร์ซ
ด้วยเจตนารมณ์หลักของ TradingView ผู้สร้างสคริปต์นี้ได้ทำให้เป็นโอเพนซอร์ส เพื่อให้เทรดเดอร์สามารถตรวจสอบและยืนยันฟังก์ชันการทำงานของมันได้ ขอชื่นชมผู้เขียน! แม้ว่าคุณจะใช้งานได้ฟรี แต่โปรดจำไว้ว่าการเผยแพร่โค้ดซ้ำจะต้องเป็นไปตาม กฎระเบียบการใช้งาน ของเรา
คำจำกัดสิทธิ์ความรับผิดชอบ
ข้อมูลและบทความไม่ได้มีวัตถุประสงค์เพื่อก่อให้เกิดกิจกรรมทางการเงิน, การลงทุน, การซื้อขาย, ข้อเสนอแนะ หรือคำแนะนำประเภทอื่น ๆ ที่ให้หรือรับรองโดย TradingView อ่านเพิ่มเติมใน ข้อกำหนดการใช้งาน