OPEN-SOURCE SCRIPT
ที่อัปเดต: 3cf
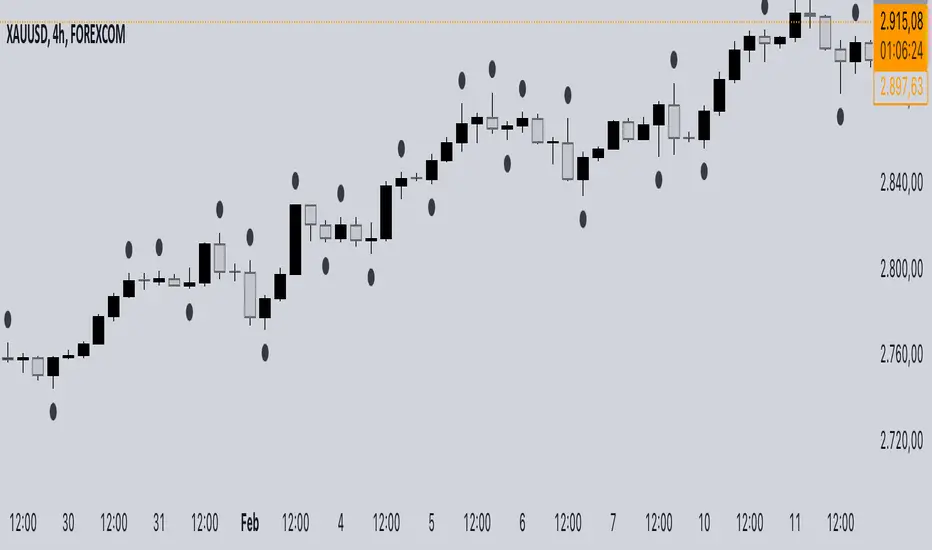
This indicator identifies and signals the points of swing highs and swing lows on the price chart using an algorithm based on market structure. Local highs and lows are highlighted with a colored dot, making it easier to perform technical analysis and recognize trend reversals.
The indicator analyzes a predefined number of bars (e.g., 5 candles) to determine relative highs and lows:
Swing High (Local High) → The current candle has a higher high compared to the previous and subsequent candle.
Swing Low (Local Low) → The current candle has a lower low compared to the previous and subsequent candle.
When a candle meets one of these conditions, a visual dot is placed to indicate the potential reversal point.
เอกสารเผยแพร่
Added a toggle option to enable or disable the display of local highs and lows in the script. This is done using an input(true, title="Show max/min") checkbox, which allows users to control whether the plotted markers for highs and lows are shown. The plotshape functions are modified to check the enableDisplay variable, ensuring that the circles are only drawn when the option is enabled.สคริปต์โอเพนซอร์ซ
ด้วยเจตนารมณ์หลักของ TradingView ผู้สร้างสคริปต์นี้ได้ทำให้เป็นโอเพนซอร์ส เพื่อให้เทรดเดอร์สามารถตรวจสอบและยืนยันฟังก์ชันการทำงานของมันได้ ขอชื่นชมผู้เขียน! แม้ว่าคุณจะใช้งานได้ฟรี แต่โปรดจำไว้ว่าการเผยแพร่โค้ดซ้ำจะต้องเป็นไปตาม กฎระเบียบการใช้งาน ของเรา
คำจำกัดสิทธิ์ความรับผิดชอบ
ข้อมูลและบทความไม่ได้มีวัตถุประสงค์เพื่อก่อให้เกิดกิจกรรมทางการเงิน, การลงทุน, การซื้อขาย, ข้อเสนอแนะ หรือคำแนะนำประเภทอื่น ๆ ที่ให้หรือรับรองโดย TradingView อ่านเพิ่มเติมใน ข้อกำหนดการใช้งาน
สคริปต์โอเพนซอร์ซ
ด้วยเจตนารมณ์หลักของ TradingView ผู้สร้างสคริปต์นี้ได้ทำให้เป็นโอเพนซอร์ส เพื่อให้เทรดเดอร์สามารถตรวจสอบและยืนยันฟังก์ชันการทำงานของมันได้ ขอชื่นชมผู้เขียน! แม้ว่าคุณจะใช้งานได้ฟรี แต่โปรดจำไว้ว่าการเผยแพร่โค้ดซ้ำจะต้องเป็นไปตาม กฎระเบียบการใช้งาน ของเรา
คำจำกัดสิทธิ์ความรับผิดชอบ
ข้อมูลและบทความไม่ได้มีวัตถุประสงค์เพื่อก่อให้เกิดกิจกรรมทางการเงิน, การลงทุน, การซื้อขาย, ข้อเสนอแนะ หรือคำแนะนำประเภทอื่น ๆ ที่ให้หรือรับรองโดย TradingView อ่านเพิ่มเติมใน ข้อกำหนดการใช้งาน