OPEN-SOURCE SCRIPT
Diamond Grids @shrilss
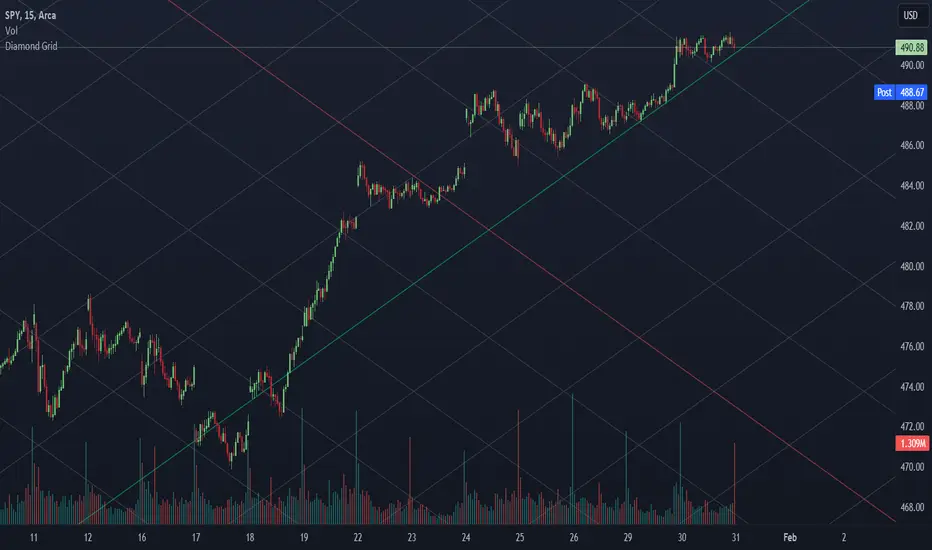
Uncover hidden patterns and potential reversal zones with the Diamond Grids Indicator. This script introduces a unique approach to visualizing price extremes within a specified range, aiding traders in identifying critical support and resistance levels. The indicator dynamically calculates and displays diamond-shaped grids based on user-defined short and long lengths and ATR. Utilize this powerful tool to enhance your technical analysis and gain insights into potential trend reversals.
Key Features:
- Dynamic Grid Calculation: The indicator dynamically calculates and plots diamond-shaped grids based on specified short and long lengths. These grids represent key price extremes within the defined range.
- Multi-Level Support and Resistance: Each diamond grid consists of multiple support and resistance lines, providing a comprehensive view of potential reversal zones. Traders can use these levels to make informed decisions.
- Customizable Parameters: Tailor the indicator to your trading style with customizable parameters such as short length, long length, and a multiplier. Adjust these settings to align the indicator with your unique preferences.
- Real-Time Updates: The indicator updates in real-time, ensuring that traders have the latest information on potential reversal zones. Stay ahead of market movements and make timely decisions.
- Toggle Trend Visualization: Diamond-shaped grids are color-coded for easy interpretation. Positive and negative grid lines are distinctly marked, offering a clear visual representation of the overall trend.
สคริปต์โอเพนซอร์ซ
ด้วยเจตนารมณ์หลักของ TradingView ผู้สร้างสคริปต์นี้ได้ทำให้เป็นโอเพนซอร์ส เพื่อให้เทรดเดอร์สามารถตรวจสอบและยืนยันฟังก์ชันการทำงานของมันได้ ขอชื่นชมผู้เขียน! แม้ว่าคุณจะใช้งานได้ฟรี แต่โปรดจำไว้ว่าการเผยแพร่โค้ดซ้ำจะต้องเป็นไปตาม กฎระเบียบการใช้งาน ของเรา
คำจำกัดสิทธิ์ความรับผิดชอบ
ข้อมูลและบทความไม่ได้มีวัตถุประสงค์เพื่อก่อให้เกิดกิจกรรมทางการเงิน, การลงทุน, การซื้อขาย, ข้อเสนอแนะ หรือคำแนะนำประเภทอื่น ๆ ที่ให้หรือรับรองโดย TradingView อ่านเพิ่มเติมใน ข้อกำหนดการใช้งาน