OPEN-SOURCE SCRIPT
Consecutive Lower Highs/Higher Lows v1 [tradinggeniusberlin]

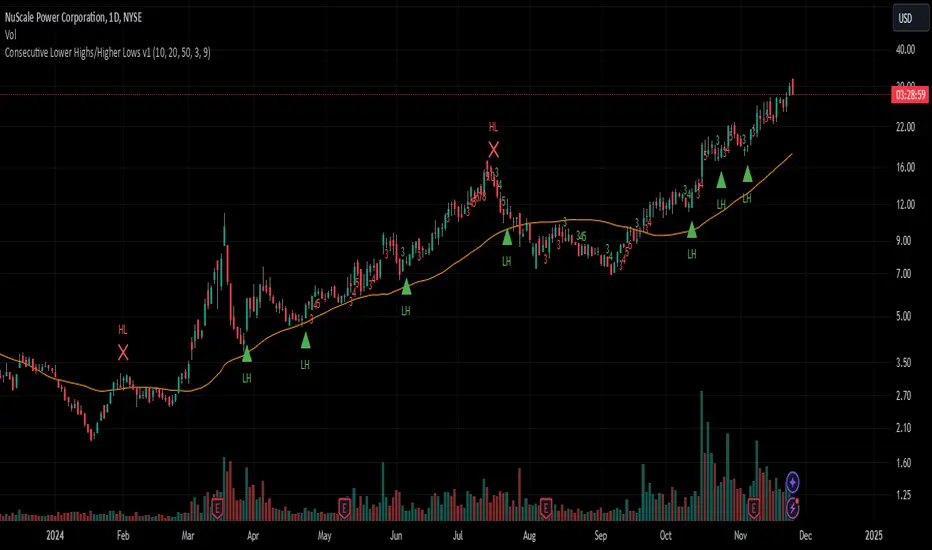
This indicator counts the lower highs and higher low streaks. If the streak is above a certain threshold a buy or exit arrow is shown.
Idea:
The probability of a reversal is rising the more lower highs the asset had already because if mean reversion tendencies of asset prices. Especially in uptrend above the 20ma and/or 50ma.
How to use it:
In Uptrends, lower high streak of 3 or more, enter at first new high.
Idea:
The probability of a reversal is rising the more lower highs the asset had already because if mean reversion tendencies of asset prices. Especially in uptrend above the 20ma and/or 50ma.
How to use it:
In Uptrends, lower high streak of 3 or more, enter at first new high.
สคริปต์โอเพนซอร์ซ
ด้วยเจตนารมณ์หลักของ TradingView ผู้สร้างสคริปต์นี้ได้ทำให้เป็นโอเพนซอร์ส เพื่อให้เทรดเดอร์สามารถตรวจสอบและยืนยันฟังก์ชันการทำงานของมันได้ ขอชื่นชมผู้เขียน! แม้ว่าคุณจะใช้งานได้ฟรี แต่โปรดจำไว้ว่าการเผยแพร่โค้ดซ้ำจะต้องเป็นไปตาม กฎระเบียบการใช้งาน ของเรา
คำจำกัดสิทธิ์ความรับผิดชอบ
ข้อมูลและบทความไม่ได้มีวัตถุประสงค์เพื่อก่อให้เกิดกิจกรรมทางการเงิน, การลงทุน, การซื้อขาย, ข้อเสนอแนะ หรือคำแนะนำประเภทอื่น ๆ ที่ให้หรือรับรองโดย TradingView อ่านเพิ่มเติมใน ข้อกำหนดการใช้งาน