OPEN-SOURCE SCRIPT
ที่อัปเดต: RoGr75 - EMA 50/8 Cross With Buy/Sell Signals
RoGr75 - EMA 50/8 Cross With Buy/Sell Signals
---
**Overview:**
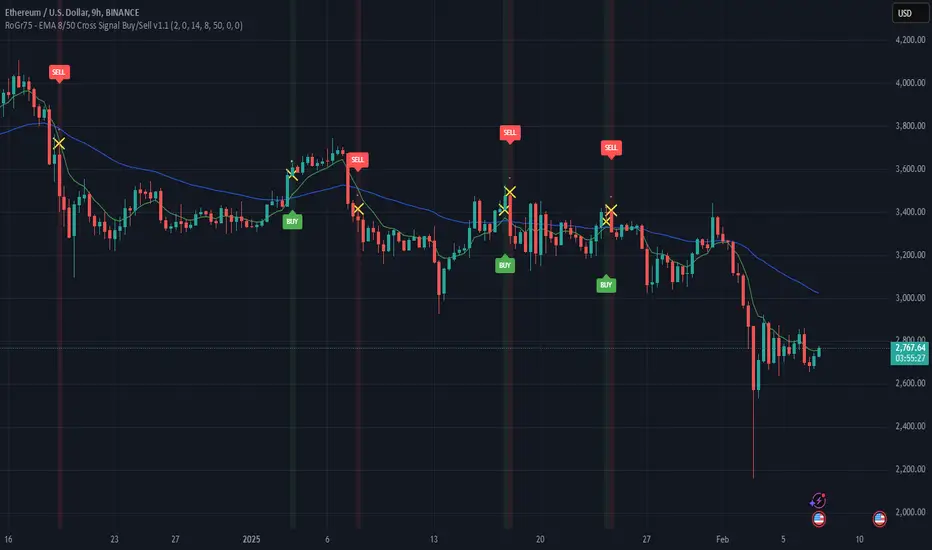
This script is designed to generate **Buy** and **Sell** signals based on the crossover and crossunder of two Exponential Moving Averages (EMAs): **EMA 8** (green line) and **EMA 50** (blue line). The signals are plotted at a user-defined distance from the candles, ensuring clear visibility and adaptability to market volatility.
---
**Key Features:**
1. **EMA Cross Signals**:
- A **Buy Signal** is generated when the **EMA 8** crosses above the **EMA 50**.
- A **Sell Signal** is generated when the **EMA 8** crosses below the **EMA 50**.
2. **Variable Signal Distance**:
- The distance of the Buy and Sell signals from the candles is controlled by a **user-defined input** (`signal_distance`).
- The distance is calculated using the **Average True Range (ATR)** to adapt to market volatility.
3. **Customizable Parameters**:
- `signal_distance`: Adjust the distance of the signals from the candles (default: 2.0).
- ATR period: Fixed at 14 but can be modified in the script.
4. **Visual Enhancements**:
- Buy signals are displayed as green labels below the candles.
- Sell signals are displayed as red labels above the candles.
- Optional background highlighting for Buy and Sell signals.
---
**How It Works:**
- The script calculates the **EMA 8** and **EMA 50** and plots them on the chart.
- When a crossover or crossunder occurs, a label is placed at a distance determined by the formula:
- **Buy Signal Position**: `low - (signal_distance * ATR(14))`
- **Sell Signal Position**: `high + (signal_distance * ATR(14))`
- The signals are clearly visible and adapt to the volatility of the asset.
---
**Input Parameters:**
- `signal_distance` (type: input float): Controls the distance of the Buy and Sell signals from the candles. Default value is `2.0`.
---
**Usage:**
1. Add the script to your chart in TradingView.
2. Adjust the `signal_distance` input to set the desired distance of the signals from the candles.
3. Monitor the Buy and Sell signals generated by the script for potential trading opportunities.
---
**Example:**
- If `signal_distance` is set to `2.0`, the Buy signal will appear **2x ATR** below the candle's low, and the Sell signal will appear **2x ATR** above the candle's high.
---
**Customization:**
- Modify the ATR period or replace it with a fixed value for static distance.
- Adjust the colors, styles, and sizes of the labels and EMAs to suit your preferences.
---
**Ideal For:**
- Traders looking for a simple and effective EMA crossover strategy.
- Users who want customizable signal placement for better visibility.
- Those who prefer volatility-adjusted signal distances.
---
**Note:**
This script is for educational and informational purposes only. Always backtest and validate strategies before using them in live trading.
---
**Overview:**
This script is designed to generate **Buy** and **Sell** signals based on the crossover and crossunder of two Exponential Moving Averages (EMAs): **EMA 8** (green line) and **EMA 50** (blue line). The signals are plotted at a user-defined distance from the candles, ensuring clear visibility and adaptability to market volatility.
---
**Key Features:**
1. **EMA Cross Signals**:
- A **Buy Signal** is generated when the **EMA 8** crosses above the **EMA 50**.
- A **Sell Signal** is generated when the **EMA 8** crosses below the **EMA 50**.
2. **Variable Signal Distance**:
- The distance of the Buy and Sell signals from the candles is controlled by a **user-defined input** (`signal_distance`).
- The distance is calculated using the **Average True Range (ATR)** to adapt to market volatility.
3. **Customizable Parameters**:
- `signal_distance`: Adjust the distance of the signals from the candles (default: 2.0).
- ATR period: Fixed at 14 but can be modified in the script.
4. **Visual Enhancements**:
- Buy signals are displayed as green labels below the candles.
- Sell signals are displayed as red labels above the candles.
- Optional background highlighting for Buy and Sell signals.
---
**How It Works:**
- The script calculates the **EMA 8** and **EMA 50** and plots them on the chart.
- When a crossover or crossunder occurs, a label is placed at a distance determined by the formula:
- **Buy Signal Position**: `low - (signal_distance * ATR(14))`
- **Sell Signal Position**: `high + (signal_distance * ATR(14))`
- The signals are clearly visible and adapt to the volatility of the asset.
---
**Input Parameters:**
- `signal_distance` (type: input float): Controls the distance of the Buy and Sell signals from the candles. Default value is `2.0`.
---
**Usage:**
1. Add the script to your chart in TradingView.
2. Adjust the `signal_distance` input to set the desired distance of the signals from the candles.
3. Monitor the Buy and Sell signals generated by the script for potential trading opportunities.
---
**Example:**
- If `signal_distance` is set to `2.0`, the Buy signal will appear **2x ATR** below the candle's low, and the Sell signal will appear **2x ATR** above the candle's high.
---
**Customization:**
- Modify the ATR period or replace it with a fixed value for static distance.
- Adjust the colors, styles, and sizes of the labels and EMAs to suit your preferences.
---
**Ideal For:**
- Traders looking for a simple and effective EMA crossover strategy.
- Users who want customizable signal placement for better visibility.
- Those who prefer volatility-adjusted signal distances.
---
**Note:**
This script is for educational and informational purposes only. Always backtest and validate strategies before using them in live trading.
เอกสารเผยแพร่
**RoGr75 - EMA 8/50 Cross Signal Buy/Sell** This indicator generates buy and sell signals based on the crossover and crossunder of two Exponential Moving Averages (EMAs): a short-term EMA (default length 8) and a long-term EMA (default length 50). Key features include:
- **Customizable Buffers:** Add percentage buffers to reduce false signals.
- **ATR-Based Positioning:** Place signals at a dynamic distance from candles using Average True Range (ATR).
- **Exact Value Offset:** Fine-tune the exact position of signal markers.
- **Visual Alerts:** Clear "BUY" and "SELL" labels with background highlighting for easy identification.
- **Alerts:** Set up TradingView alerts for timely notifications.
Perfect for traders looking to identify trend reversals and momentum shifts with precision and flexibility. Customize inputs to suit your strategy!
**Disclaimer:** This indicator is provided for educational and informational purposes only. Use it at your own risk. Trading involves substantial risk, and you should consult a financial advisor before making any trading decisions. The creator of this indicator is not responsible for any financial losses incurred.
เอกสารเผยแพร่
Indicator Description: RoGr75 - EMA 8/50 Cross Signal Buy/SellThis Pine Script indicator is designed to help traders identify potential buy and sell signals based on the crossover and crossunder of two Exponential Moving Averages (EMAs): a short-term EMA (default: 8-period) and a long-term EMA (default: 50-period). The script provides visual cues, including labels and background highlights, to make it easier to spot these signals on your TradingView chart.
Key Features:
EMA Crossover/Crossunder Signals :
A BUY signal is generated when the shorter EMA (8-period) crosses above the longer EMA (50-period), optionally with a buffer percentage.
A SELL signal is generated when the shorter EMA crosses below the longer EMA, also optionally with a buffer percentage.
Customizable Inputs :
You can adjust the lengths of the EMAs, the distance of the signal labels from the candles using ATR (Average True Range), and add buffer percentages to fine-tune the signal generation.
The "Signal Distance" input allows you to control how far the BUY/SELL labels appear from the price action.
Visual Indicators :
BUY signals are marked with green "BUY" labels below the candle and a "+" sign near the exact value.
SELL signals are marked with red "SELL" labels above the candle and a "-" sign near the exact value.
Background highlights (light green for BUY and light red for SELL) provide additional visual emphasis.
Alerts :
Alerts are set up for both BUY and SELL signals, allowing you to receive notifications when a crossover or crossunder occurs.
How It Works:
The script calculates the short EMA (8-period) and long EMA (50-period) and plots them on the chart.
When the short EMA crosses above the long EMA (plus any optional buffer), a BUY signal is triggered.
Conversely, when the short EMA crosses below the long EMA (minus any optional buffer), a SELL signal is triggered.
To avoid duplicate signals, the script ensures that a BUY signal is only generated if the previous signal was not a BUY, and similarly for SELL signals.
Important Notes:
Testing Only : This script is intended for educational and testing purposes only. Always backtest and validate its performance on historical data before using it in live trading.
Risk Warning : Trading involves significant risk, and no indicator guarantees profitable trades. Use proper risk management techniques and consider consulting with a financial advisor.
สคริปต์โอเพนซอร์ซ
ด้วยเจตนารมณ์หลักของ TradingView ผู้สร้างสคริปต์นี้ได้ทำให้เป็นโอเพนซอร์ส เพื่อให้เทรดเดอร์สามารถตรวจสอบและยืนยันฟังก์ชันการทำงานของมันได้ ขอชื่นชมผู้เขียน! แม้ว่าคุณจะใช้งานได้ฟรี แต่โปรดจำไว้ว่าการเผยแพร่โค้ดซ้ำจะต้องเป็นไปตาม กฎระเบียบการใช้งาน ของเรา
คำจำกัดสิทธิ์ความรับผิดชอบ
ข้อมูลและบทความไม่ได้มีวัตถุประสงค์เพื่อก่อให้เกิดกิจกรรมทางการเงิน, การลงทุน, การซื้อขาย, ข้อเสนอแนะ หรือคำแนะนำประเภทอื่น ๆ ที่ให้หรือรับรองโดย TradingView อ่านเพิ่มเติมใน ข้อกำหนดการใช้งาน