OPEN-SOURCE SCRIPT
Swing S/R Bounce Screener
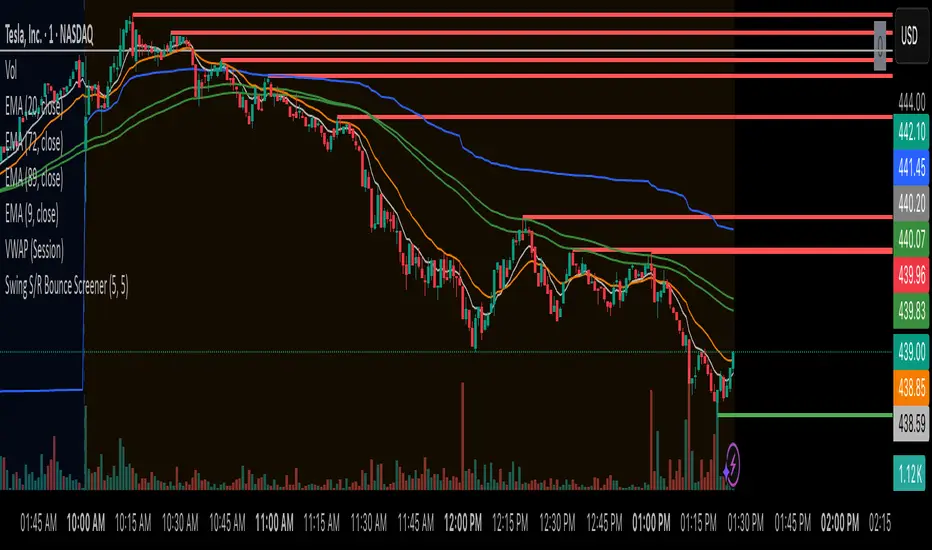
Step 1: Identify Swing Highs & Lows on 1 minute timeframe
- price bars that stand out from the 5 bars on each side (left and right). A swing high is a bar whose high is higher than the 5 bars before and after it. A swing low is a bar whose low is lower than the 5 bars before and after it.
Step 2: Draw Horizontal Lines
When a swing high/low is identified, the scanner draws a horizontal line from that point extending to the right of the chart.
Step 3: Monitor Price Returns
The scanner continuously watches for price to return to these horizontal lines. When price approaches and touches the line:
* Resistance: Price touches from below and closes below the line
* Support: Price touches from above and closes above the line
สคริปต์โอเพนซอร์ซ
ด้วยเจตนารมณ์หลักของ TradingView ผู้สร้างสคริปต์นี้ได้ทำให้มันเป็นโอเพ่นซอร์ส เพื่อให้เทรดเดอร์สามารถตรวจสอบและยืนยันการทำงานของสคริปต์ได้ ขอแสดงความชื่นชมผู้เขียน! แม้ว่าคุณจะสามารถใช้งานได้ฟรี แต่อย่าลืมว่าการเผยแพร่โค้ดซ้ำนั้นจะต้องเป็นไปตามกฎระเบียบการใช้งานของเรา
คำจำกัดสิทธิ์ความรับผิดชอบ
ข้อมูลและบทความไม่ได้มีวัตถุประสงค์เพื่อก่อให้เกิดกิจกรรมทางการเงิน, การลงทุน, การซื้อขาย, ข้อเสนอแนะ หรือคำแนะนำประเภทอื่น ๆ ที่ให้หรือรับรองโดย TradingView อ่านเพิ่มเติมที่ ข้อกำหนดการใช้งาน