OPEN-SOURCE SCRIPT
ETN - Volume Candle
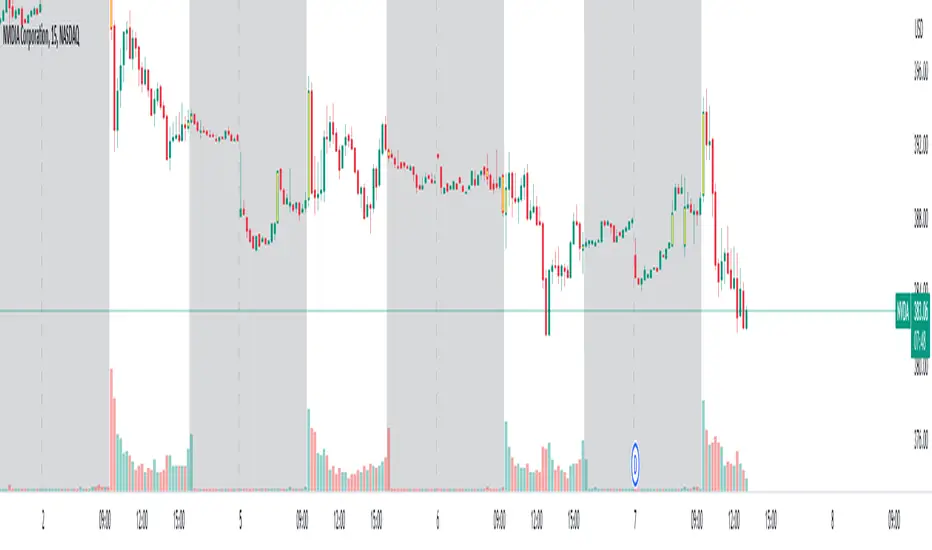
Highlights candlestick based on volume data.
Indicator looks back and analyzing volume to find the volume bar with the largest numerical value
Indicator highlights the corresponding candlestick.
Indicator marks the high and low of that candlestick.
Users can adjust lookback period. Default is set to 50.
Users can adjust how the indicator plots the high and low.
I currently have the high and low not being displayed on the charts until I come up with a better version.
On my chart, indicator colored the candlesticks YELLOW.
สคริปต์โอเพนซอร์ซ
ด้วยเจตนารมณ์หลักของ TradingView ผู้สร้างสคริปต์นี้ได้ทำให้เป็นโอเพนซอร์ส เพื่อให้เทรดเดอร์สามารถตรวจสอบและยืนยันฟังก์ชันการทำงานของมันได้ ขอชื่นชมผู้เขียน! แม้ว่าคุณจะใช้งานได้ฟรี แต่โปรดจำไว้ว่าการเผยแพร่โค้ดซ้ำจะต้องเป็นไปตาม กฎระเบียบการใช้งาน ของเรา
คำจำกัดสิทธิ์ความรับผิดชอบ
ข้อมูลและบทความไม่ได้มีวัตถุประสงค์เพื่อก่อให้เกิดกิจกรรมทางการเงิน, การลงทุน, การซื้อขาย, ข้อเสนอแนะ หรือคำแนะนำประเภทอื่น ๆ ที่ให้หรือรับรองโดย TradingView อ่านเพิ่มเติมใน ข้อกำหนดการใช้งาน