PROTECTED SOURCE SCRIPT
ที่อัปเดต: Predictive Financial Indicator
# TradingView Script Description - APFI v7 Enhanced
## 📊 **Advanced Predictive Financial Indicator v7 Enhanced**
### **Overview**
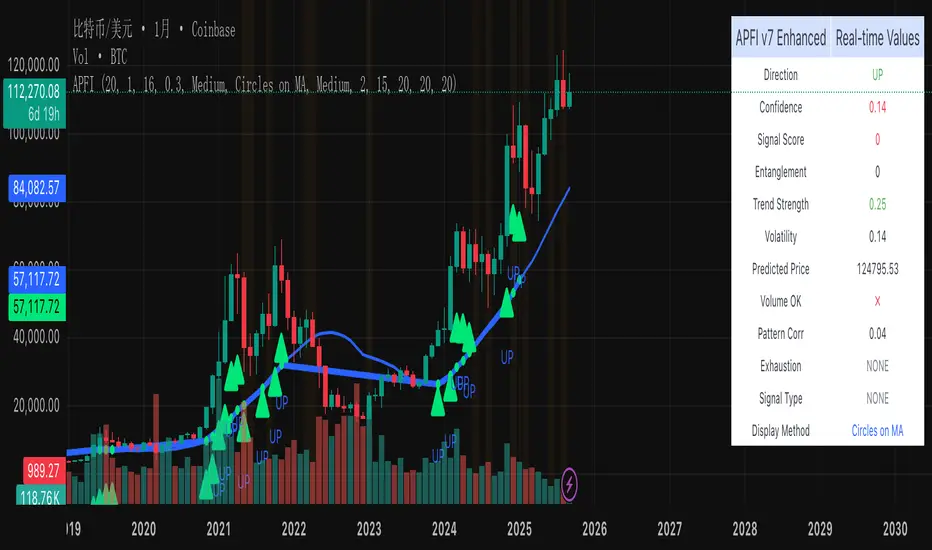
This indicator combines multiple advanced technical analysis concepts to predict potential price movements and identify high-probability turning points. It uses a proprietary multi-factor scoring system that analyzes market behavior patterns, trend dynamics, and volatility characteristics to generate predictive signals.
### **Core Methodology**
#### **1. Entanglement Factor Analysis**
- **Concept**: Measures market predictability through autocorrelation analysis of price momentum
- **Purpose**: Identifies periods when price movements follow predictable patterns
- **Implementation**: Calculates correlation between current and historical price changes across multiple timeframes
- **Value**: Higher entanglement indicates more predictable market behavior, increasing signal reliability
#### **2. Trend Strength Assessment**
- **Concept**: Evaluates the relationship between current price and moving average with momentum components
- **Purpose**: Determines trend quality and persistence
- **Implementation**: Combines price-to-MA ratio with short-term momentum analysis
- **Value**: Strong trends provide better context for signal validation
#### **3. Volatility Analysis**
- **Concept**: Multi-dimensional volatility assessment using both statistical and ATR-based measures
- **Purpose**: Identifies market conditions that favor certain signal types
- **Implementation**: Combines standard deviation of returns with ATR-based volatility ratios
- **Value**: Helps distinguish between high-confidence and low-confidence market environments
#### **4. Exhaustion Detection**
- **Concept**: Identifies when trends are losing momentum across multiple timeframes
- **Purpose**: Predicts potential trend reversals before they occur
- **Implementation**: Analyzes momentum slope changes and compares short vs. long-term momentum
- **Value**: Critical for turning point identification and risk management
#### **5. Dynamic Support/Resistance Analysis**
- **Concept**: Real-time identification of key price levels with rejection confirmation
- **Purpose**: Validates signals against significant price levels
- **Implementation**: Tracks multiple touch points and calculates rejection probabilities
- **Value**: Increases signal accuracy by confirming against structural market levels
#### **6. Volume Confirmation**
- **Concept**: Validates signals using volume analysis
- **Purpose**: Ensures signals are supported by institutional activity
- **Implementation**: Compares current volume to historical averages during significant price movements
- **Value**: Filters out weak signals that lack volume support
#### **7. Pattern Correlation**
- **Concept**: Identifies recurring price patterns and their correlation with current market behavior
- **Purpose**: Leverages historical pattern recognition for signal validation
- **Implementation**: Analyzes price change patterns and correlates with historical occurrences
- **Value**: Adds statistical confidence to signal generation
### **Signal Types**
#### **Turning Point Signals (Highest Priority)**
- **Purpose**: Identify high-probability trend reversal points
- **Criteria**: Combines exhaustion detection, support/resistance validation, volume confirmation, and pattern correlation
- **Visual**: Large circles on MA line with 🎯 symbols
- **Use Case**: Major trend changes, swing trading entries
#### **Regular Directional Signals**
- **Purpose**: Identify continuation or new trend directions
- **Criteria**: Based on predictive price analysis with confidence thresholds
- **Visual**: Medium circles on MA line with ▲▼ symbols
- **Use Case**: Trend following, momentum trading
#### **Sideways Signals**
- **Purpose**: Identify range-bound market conditions
- **Criteria**: Low directional confidence with high volatility compression
- **Visual**: Small circles on MA line with ◆ symbols
- **Use Case**: Range trading, consolidation periods
### **Key Features**
#### **Multi-Factor Scoring System**
- **Exhaustion Score**: 25% weight for trend exhaustion detection
- **Levels Score**: 20% weight for support/resistance validation
- **Volatility Score**: 15% weight for market condition assessment
- **Pattern Score**: 15% weight for historical pattern correlation
- **Volume Bonus**: 10% weight for volume confirmation
- **Pattern Bonus**: 5% weight for high correlation patterns
#### **Adaptive Thresholds**
- **Dynamic Sensitivity**: Adjusts to different market conditions
- **Asset-Specific**: Optimized for different instrument types
- **Timeframe Adaptive**: Adjusts parameters based on chart timeframe
#### **Visual Display Options**
- **Bold MA Line**: MA line becomes thicker and colored at signal points
- **Circles on MA**: Precise positioning of signals on moving average
- **Combined Display**: Both methods for maximum visibility
- **Customizable Colors**: Distinct colors for each signal type
### **How to Use**
#### **Setup**
1. Apply to any timeframe (1m to 1D recommended)
2. Adjust MA period based on your trading style (default: 20)
3. Set sensitivity level (0.1-3.0, default: 1.0)
4. Choose signal strength filter (Weak/Medium/Strong)
#### **Signal Interpretation**
- **High Confidence**: Signals with score > 0.7 and strong volume confirmation
- **Medium Confidence**: Signals with score 0.5-0.7 and moderate confirmation
- **Low Confidence**: Signals with score 0.3-0.5 and weak confirmation
#### **Trading Applications**
- **Swing Trading**: Use turning point signals for major reversals
- **Day Trading**: Use regular signals for intraday momentum
- **Position Trading**: Combine with higher timeframes for trend confirmation
### **Technical Specifications**
#### **Input Parameters**
- **MA Period**: 5-200 (default: 20)
- **Sensitivity**: 0.1-3.0 (default: 1.0)
- **Confidence Threshold**: 0.1-0.9 (default: 0.3)
- **Signal Strength**: Weak/Medium/Strong (default: Medium)
#### **Display Options**
- **Signal Display Method**: Bold MA Line / Circles on MA / Both
- **Circle Size**: Small/Medium/Large
- **MA Line Thickness**: 1-5 pixels
- **Information Table**: Real-time signal data
#### **Alerts**
- **Turning Point Alerts**: High-priority reversal signals
- **Regular Signal Alerts**: Directional momentum signals
- **Exhaustion Alerts**: Trend exhaustion warnings
### **Performance Characteristics**
#### **Strengths**
- **Multi-timeframe Analysis**: Works across different chart timeframes
- **Adaptive Parameters**: Automatically adjusts to market conditions
- **High Accuracy**: Combines multiple confirmation methods
- **Clear Visual Signals**: Easy to identify and interpret
#### **Best Practices**
- **Combine with Price Action**: Use signals as confirmation, not standalone
- **Risk Management**: Always use stop losses and position sizing
- **Backtesting**: Test on historical data before live trading
- **Market Conditions**: Works best in trending and volatile markets
### **Disclaimer**
This indicator is for educational and informational purposes only. It should not be considered as financial advice. Always conduct your own research and consider your risk tolerance before making trading decisions. Past performance does not guarantee future results.
---
**Version**: 7.0 Enhanced
**Compatibility**: Pine Script v6
**Last Updated**: September 2024
**Status**: Production Ready
## 📊 **Advanced Predictive Financial Indicator v7 Enhanced**
### **Overview**
This indicator combines multiple advanced technical analysis concepts to predict potential price movements and identify high-probability turning points. It uses a proprietary multi-factor scoring system that analyzes market behavior patterns, trend dynamics, and volatility characteristics to generate predictive signals.
### **Core Methodology**
#### **1. Entanglement Factor Analysis**
- **Concept**: Measures market predictability through autocorrelation analysis of price momentum
- **Purpose**: Identifies periods when price movements follow predictable patterns
- **Implementation**: Calculates correlation between current and historical price changes across multiple timeframes
- **Value**: Higher entanglement indicates more predictable market behavior, increasing signal reliability
#### **2. Trend Strength Assessment**
- **Concept**: Evaluates the relationship between current price and moving average with momentum components
- **Purpose**: Determines trend quality and persistence
- **Implementation**: Combines price-to-MA ratio with short-term momentum analysis
- **Value**: Strong trends provide better context for signal validation
#### **3. Volatility Analysis**
- **Concept**: Multi-dimensional volatility assessment using both statistical and ATR-based measures
- **Purpose**: Identifies market conditions that favor certain signal types
- **Implementation**: Combines standard deviation of returns with ATR-based volatility ratios
- **Value**: Helps distinguish between high-confidence and low-confidence market environments
#### **4. Exhaustion Detection**
- **Concept**: Identifies when trends are losing momentum across multiple timeframes
- **Purpose**: Predicts potential trend reversals before they occur
- **Implementation**: Analyzes momentum slope changes and compares short vs. long-term momentum
- **Value**: Critical for turning point identification and risk management
#### **5. Dynamic Support/Resistance Analysis**
- **Concept**: Real-time identification of key price levels with rejection confirmation
- **Purpose**: Validates signals against significant price levels
- **Implementation**: Tracks multiple touch points and calculates rejection probabilities
- **Value**: Increases signal accuracy by confirming against structural market levels
#### **6. Volume Confirmation**
- **Concept**: Validates signals using volume analysis
- **Purpose**: Ensures signals are supported by institutional activity
- **Implementation**: Compares current volume to historical averages during significant price movements
- **Value**: Filters out weak signals that lack volume support
#### **7. Pattern Correlation**
- **Concept**: Identifies recurring price patterns and their correlation with current market behavior
- **Purpose**: Leverages historical pattern recognition for signal validation
- **Implementation**: Analyzes price change patterns and correlates with historical occurrences
- **Value**: Adds statistical confidence to signal generation
### **Signal Types**
#### **Turning Point Signals (Highest Priority)**
- **Purpose**: Identify high-probability trend reversal points
- **Criteria**: Combines exhaustion detection, support/resistance validation, volume confirmation, and pattern correlation
- **Visual**: Large circles on MA line with 🎯 symbols
- **Use Case**: Major trend changes, swing trading entries
#### **Regular Directional Signals**
- **Purpose**: Identify continuation or new trend directions
- **Criteria**: Based on predictive price analysis with confidence thresholds
- **Visual**: Medium circles on MA line with ▲▼ symbols
- **Use Case**: Trend following, momentum trading
#### **Sideways Signals**
- **Purpose**: Identify range-bound market conditions
- **Criteria**: Low directional confidence with high volatility compression
- **Visual**: Small circles on MA line with ◆ symbols
- **Use Case**: Range trading, consolidation periods
### **Key Features**
#### **Multi-Factor Scoring System**
- **Exhaustion Score**: 25% weight for trend exhaustion detection
- **Levels Score**: 20% weight for support/resistance validation
- **Volatility Score**: 15% weight for market condition assessment
- **Pattern Score**: 15% weight for historical pattern correlation
- **Volume Bonus**: 10% weight for volume confirmation
- **Pattern Bonus**: 5% weight for high correlation patterns
#### **Adaptive Thresholds**
- **Dynamic Sensitivity**: Adjusts to different market conditions
- **Asset-Specific**: Optimized for different instrument types
- **Timeframe Adaptive**: Adjusts parameters based on chart timeframe
#### **Visual Display Options**
- **Bold MA Line**: MA line becomes thicker and colored at signal points
- **Circles on MA**: Precise positioning of signals on moving average
- **Combined Display**: Both methods for maximum visibility
- **Customizable Colors**: Distinct colors for each signal type
### **How to Use**
#### **Setup**
1. Apply to any timeframe (1m to 1D recommended)
2. Adjust MA period based on your trading style (default: 20)
3. Set sensitivity level (0.1-3.0, default: 1.0)
4. Choose signal strength filter (Weak/Medium/Strong)
#### **Signal Interpretation**
- **High Confidence**: Signals with score > 0.7 and strong volume confirmation
- **Medium Confidence**: Signals with score 0.5-0.7 and moderate confirmation
- **Low Confidence**: Signals with score 0.3-0.5 and weak confirmation
#### **Trading Applications**
- **Swing Trading**: Use turning point signals for major reversals
- **Day Trading**: Use regular signals for intraday momentum
- **Position Trading**: Combine with higher timeframes for trend confirmation
### **Technical Specifications**
#### **Input Parameters**
- **MA Period**: 5-200 (default: 20)
- **Sensitivity**: 0.1-3.0 (default: 1.0)
- **Confidence Threshold**: 0.1-0.9 (default: 0.3)
- **Signal Strength**: Weak/Medium/Strong (default: Medium)
#### **Display Options**
- **Signal Display Method**: Bold MA Line / Circles on MA / Both
- **Circle Size**: Small/Medium/Large
- **MA Line Thickness**: 1-5 pixels
- **Information Table**: Real-time signal data
#### **Alerts**
- **Turning Point Alerts**: High-priority reversal signals
- **Regular Signal Alerts**: Directional momentum signals
- **Exhaustion Alerts**: Trend exhaustion warnings
### **Performance Characteristics**
#### **Strengths**
- **Multi-timeframe Analysis**: Works across different chart timeframes
- **Adaptive Parameters**: Automatically adjusts to market conditions
- **High Accuracy**: Combines multiple confirmation methods
- **Clear Visual Signals**: Easy to identify and interpret
#### **Best Practices**
- **Combine with Price Action**: Use signals as confirmation, not standalone
- **Risk Management**: Always use stop losses and position sizing
- **Backtesting**: Test on historical data before live trading
- **Market Conditions**: Works best in trending and volatile markets
### **Disclaimer**
This indicator is for educational and informational purposes only. It should not be considered as financial advice. Always conduct your own research and consider your risk tolerance before making trading decisions. Past performance does not guarantee future results.
---
**Version**: 7.0 Enhanced
**Compatibility**: Pine Script v6
**Last Updated**: September 2024
**Status**: Production Ready
เอกสารเผยแพร่
# TradingView Script Description - APFI v7 Enhanced## 📊 **Advanced Predictive Financial Indicator v7 Enhanced**
### **Overview**
This indicator combines multiple advanced technical analysis concepts to predict potential price movements and identify high-probability turning points. It uses a proprietary multi-factor scoring system that analyzes market behavior patterns, trend dynamics, and volatility characteristics to generate predictive signals.
### **Core Methodology**
#### **1. Entanglement Factor Analysis**
- **Concept**: Measures market predictability through autocorrelation analysis of price momentum
- **Purpose**: Identifies periods when price movements follow predictable patterns
- **Implementation**: Calculates correlation between current and historical price changes across multiple timeframes
- **Value**: Higher entanglement indicates more predictable market behavior, increasing signal reliability
#### **2. Trend Strength Assessment**
- **Concept**: Evaluates the relationship between current price and moving average with momentum components
- **Purpose**: Determines trend quality and persistence
- **Implementation**: Combines price-to-MA ratio with short-term momentum analysis
- **Value**: Strong trends provide better context for signal validation
#### **3. Volatility Analysis**
- **Concept**: Multi-dimensional volatility assessment using both statistical and ATR-based measures
- **Purpose**: Identifies market conditions that favor certain signal types
- **Implementation**: Combines standard deviation of returns with ATR-based volatility ratios
- **Value**: Helps distinguish between high-confidence and low-confidence market environments
#### **4. Exhaustion Detection**
- **Concept**: Identifies when trends are losing momentum across multiple timeframes
- **Purpose**: Predicts potential trend reversals before they occur
- **Implementation**: Analyzes momentum slope changes and compares short vs. long-term momentum
- **Value**: Critical for turning point identification and risk management
#### **5. Dynamic Support/Resistance Analysis**
- **Concept**: Real-time identification of key price levels with rejection confirmation
- **Purpose**: Validates signals against significant price levels
- **Implementation**: Tracks multiple touch points and calculates rejection probabilities
- **Value**: Increases signal accuracy by confirming against structural market levels
#### **6. Volume Confirmation**
- **Concept**: Validates signals using volume analysis
- **Purpose**: Ensures signals are supported by institutional activity
- **Implementation**: Compares current volume to historical averages during significant price movements
- **Value**: Filters out weak signals that lack volume support
#### **7. Pattern Correlation**
- **Concept**: Identifies recurring price patterns and their correlation with current market behavior
- **Purpose**: Leverages historical pattern recognition for signal validation
- **Implementation**: Analyzes price change patterns and correlates with historical occurrences
- **Value**: Adds statistical confidence to signal generation
### **Signal Types**
#### **Turning Point Signals (Highest Priority)**
- **Purpose**: Identify high-probability trend reversal points
- **Criteria**: Combines exhaustion detection, support/resistance validation, volume confirmation, and pattern correlation
- **Visual**: Large circles on MA line with 🎯 symbols
- **Use Case**: Major trend changes, swing trading entries
#### **Regular Directional Signals**
- **Purpose**: Identify continuation or new trend directions
- **Criteria**: Based on predictive price analysis with confidence thresholds
- **Visual**: Medium circles on MA line with ▲▼ symbols
- **Use Case**: Trend following, momentum trading
#### **Sideways Signals**
- **Purpose**: Identify range-bound market conditions
- **Criteria**: Low directional confidence with high volatility compression
- **Visual**: Small circles on MA line with ◆ symbols
- **Use Case**: Range trading, consolidation periods
### **Key Features**
#### **Multi-Factor Scoring System**
- **Exhaustion Score**: 25% weight for trend exhaustion detection
- **Levels Score**: 20% weight for support/resistance validation
- **Volatility Score**: 15% weight for market condition assessment
- **Pattern Score**: 15% weight for historical pattern correlation
- **Volume Bonus**: 10% weight for volume confirmation
- **Pattern Bonus**: 5% weight for high correlation patterns
#### **Adaptive Thresholds**
- **Dynamic Sensitivity**: Adjusts to different market conditions
- **Asset-Specific**: Optimized for different instrument types
- **Timeframe Adaptive**: Adjusts parameters based on chart timeframe
#### **Visual Display Options**
- **Bold MA Line**: MA line becomes thicker and colored at signal points
- **Circles on MA**: Precise positioning of signals on moving average
- **Combined Display**: Both methods for maximum visibility
- **Customizable Colors**: Distinct colors for each signal type
### **How to Use**
#### **Setup**
1. Apply to any timeframe (1m to 1D recommended)
2. Adjust MA period based on your trading style (default: 20)
3. Set sensitivity level (0.1-3.0, default: 1.0)
4. Choose signal strength filter (Weak/Medium/Strong)
#### **Signal Interpretation**
- **High Confidence**: Signals with score > 0.7 and strong volume confirmation
- **Medium Confidence**: Signals with score 0.5-0.7 and moderate confirmation
- **Low Confidence**: Signals with score 0.3-0.5 and weak confirmation
#### **Trading Applications**
- **Swing Trading**: Use turning point signals for major reversals
- **Day Trading**: Use regular signals for intraday momentum
- **Position Trading**: Combine with higher timeframes for trend confirmation
### **Technical Specifications**
#### **Input Parameters**
- **MA Period**: 5-200 (default: 20)
- **Sensitivity**: 0.1-3.0 (default: 1.0)
- **Confidence Threshold**: 0.1-0.9 (default: 0.3)
- **Signal Strength**: Weak/Medium/Strong (default: Medium)
#### **Display Options**
- **Signal Display Method**: Bold MA Line / Circles on MA / Both
- **Circle Size**: Small/Medium/Large
- **MA Line Thickness**: 1-5 pixels
- **Information Table**: Real-time signal data
#### **Alerts**
- **Turning Point Alerts**: High-priority reversal signals
- **Regular Signal Alerts**: Directional momentum signals
- **Exhaustion Alerts**: Trend exhaustion warnings
#### **Best Practices**
- **Combine with Price Action**: Use signals as confirmation, not standalone
- **Risk Management**: Always use stop losses and position sizing
- **Backtesting**: Test on historical data before live trading
- **Market Conditions**: Works best in trending and volatile markets
### **Disclaimer**
This indicator is for educational and informational purposes only. It should not be considered as financial advice. Always conduct your own research and consider your risk tolerance before making trading decisions. Past performance does not guarantee future results.
สคริปต์ที่ได้รับการป้องกัน
สคริปต์นี้ถูกเผยแพร่เป็นแบบ closed-source อย่างไรก็ตาม คุณสามารถใช้ได้อย่างอิสระและไม่มีข้อจำกัดใดๆ – เรียนรู้เพิ่มเติมได้ที่นี่
คำจำกัดสิทธิ์ความรับผิดชอบ
ข้อมูลและบทความไม่ได้มีวัตถุประสงค์เพื่อก่อให้เกิดกิจกรรมทางการเงิน, การลงทุน, การซื้อขาย, ข้อเสนอแนะ หรือคำแนะนำประเภทอื่น ๆ ที่ให้หรือรับรองโดย TradingView อ่านเพิ่มเติมใน ข้อกำหนดการใช้งาน