OPEN-SOURCE SCRIPT
ที่อัปเดต: [ AlgoChart ] - Pearson Index Correlation
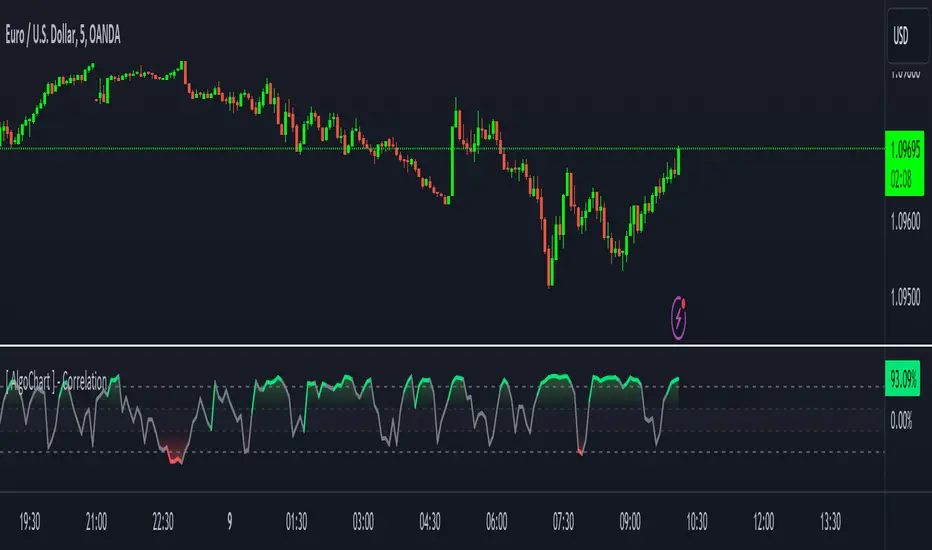
Correlation Indicator (Pearson Index)
The correlation indicator measures the strength and direction of the relationship between two financial assets using the Pearson Index.
Correlation values range from +100 to -100, where:
Interpreting Correlation Levels:
Practical Use of the Indicator:
Risk management: Use the indicator to monitor asset correlations before opening positions. High correlation may indicate you are duplicating exposure, as two highly correlated assets tend to move similarly. This helps avoid excessive risk and improves portfolio diversification.
Statistical Arbitrage: During moments of temporary decorrelation between two assets, the indicator can be used for statistical arbitrage strategies. In such cases, you can take advantage of the divergence by opening positions and closing them when the correlation returns to higher or positive levels, thus potentially profiting from the reconvergence of movements.
While the correlation indicator provides valuable insights into asset relationships, it is most effective when used in conjunction with other concepts and tools. On its own, it may offer limited relevance in trading decisions.
The correlation indicator measures the strength and direction of the relationship between two financial assets using the Pearson Index.
Correlation values range from +100 to -100, where:
- +100 indicates perfect positive correlation, meaning the two assets tend to move in the same direction.
- -100 indicates perfect negative correlation, where the two assets move in opposite directions.
- The neutral zone ranges from +25% to -25%, suggesting that the asset movements are independent, with no clear correlation between them.
Interpreting Correlation Levels:
- Correlation above +75%: The two assets tend to move similarly and in the same direction. This may indicate a risk of overexposure if both assets are traded in the same direction, as their movements will be very similar, increasing the likelihood of double losses or gains.
- Correlation below -75%: The two assets tend to move similarly but in opposite directions. This correlation level can be useful for strategies that benefit from opposing movements between assets, such as trading pairs with inverse dynamics.
Practical Use of the Indicator:
Risk management: Use the indicator to monitor asset correlations before opening positions. High correlation may indicate you are duplicating exposure, as two highly correlated assets tend to move similarly. This helps avoid excessive risk and improves portfolio diversification.
Statistical Arbitrage: During moments of temporary decorrelation between two assets, the indicator can be used for statistical arbitrage strategies. In such cases, you can take advantage of the divergence by opening positions and closing them when the correlation returns to higher or positive levels, thus potentially profiting from the reconvergence of movements.
While the correlation indicator provides valuable insights into asset relationships, it is most effective when used in conjunction with other concepts and tools. On its own, it may offer limited relevance in trading decisions.
เอกสารเผยแพร่
New Update:This version introduces significant improvements to the input panel, offering new options to give users more control over the indicator and enabling deeper and more precise analysis of various market conditions.
Change #1:
We’ve added 'Symbol A' and 'Timeframe' to the input fields, allowing you to specify the instrument and time frame for calculating the correlation. This adds flexibility: users can change the instrument being analyzed without reconfiguring the indicator, or they can conduct a structured multi-timeframe analysis by locking the first instrument and timeframe and performing a top-down analysis on the second.
Change #2:
A dropdown menu has been added to select between two correlation calculation modes:
- Correlation based on the instruments' prices;
- Correlation based on the percentage change (returns) of the candles.
Why is the 'Returns' mode so beneficial?
The 'Returns' mode is especially useful because it compares the percentage change in candles instead of absolute values. This eliminates discrepancies caused by significant price differences between two instruments, making comparisons much more consistent and accurate.
For example, directly comparing GOLD (2,718.00) with SILVER (34.45) can be problematic due to the large difference in their prices. However, when using the 'Returns' mode, the percentage changes of the candles are compared (e.g., 0.58% for GOLD and 2.07% for SILVER), making the relationship much more comparable and indicative of the true correlation between the two instruments.
สคริปต์โอเพนซอร์ซ
ด้วยเจตนารมณ์หลักของ TradingView ผู้สร้างสคริปต์นี้ได้ทำให้เป็นโอเพนซอร์ส เพื่อให้เทรดเดอร์สามารถตรวจสอบและยืนยันฟังก์ชันการทำงานของมันได้ ขอชื่นชมผู้เขียน! แม้ว่าคุณจะใช้งานได้ฟรี แต่โปรดจำไว้ว่าการเผยแพร่โค้ดซ้ำจะต้องเป็นไปตาม กฎระเบียบการใช้งาน ของเรา
คำจำกัดสิทธิ์ความรับผิดชอบ
ข้อมูลและบทความไม่ได้มีวัตถุประสงค์เพื่อก่อให้เกิดกิจกรรมทางการเงิน, การลงทุน, การซื้อขาย, ข้อเสนอแนะ หรือคำแนะนำประเภทอื่น ๆ ที่ให้หรือรับรองโดย TradingView อ่านเพิ่มเติมใน ข้อกำหนดการใช้งาน