OPEN-SOURCE SCRIPT
Bias Dashboard + All Open Lines (M/W/D/H4/H1/15min)
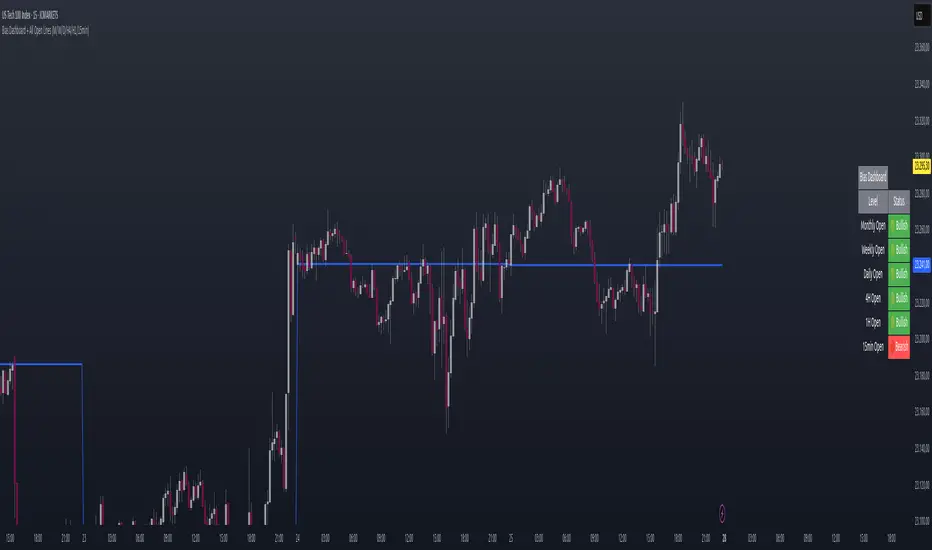
What does the script do?
This script displays a dashboard that shows the current market bias relative to the open prices of multiple timeframes:
Monthly
Weekly
Daily
4H
1H
15min
Additionally, it plots horizontal lines at each of these open levels on the chart.
How it works
Fetch Open Prices:
The script uses request.security() to get the open prices for each timeframe.
Determine Bias:
Compares the current close price to each open:
If close > open, then "Bullish"
If close < open, then "Bearish"
Display Dashboard:
A visual dashboard shows:
The timeframe label
Whether the current price is above (bullish) or below (bearish) that level
Plot Lines:
Colored horizontal lines are drawn on the chart to indicate each timeframe’s open level.
สคริปต์โอเพนซอร์ซ
ด้วยเจตนารมณ์หลักของ TradingView ผู้สร้างสคริปต์นี้ได้ทำให้เป็นโอเพนซอร์ส เพื่อให้เทรดเดอร์สามารถตรวจสอบและยืนยันฟังก์ชันการทำงานของมันได้ ขอชื่นชมผู้เขียน! แม้ว่าคุณจะใช้งานได้ฟรี แต่โปรดจำไว้ว่าการเผยแพร่โค้ดซ้ำจะต้องเป็นไปตาม กฎระเบียบการใช้งาน ของเรา
คำจำกัดสิทธิ์ความรับผิดชอบ
ข้อมูลและบทความไม่ได้มีวัตถุประสงค์เพื่อก่อให้เกิดกิจกรรมทางการเงิน, การลงทุน, การซื้อขาย, ข้อเสนอแนะ หรือคำแนะนำประเภทอื่น ๆ ที่ให้หรือรับรองโดย TradingView อ่านเพิ่มเติมใน ข้อกำหนดการใช้งาน