OPEN-SOURCE SCRIPT
ที่อัปเดต: HighLowBox 1+3TF

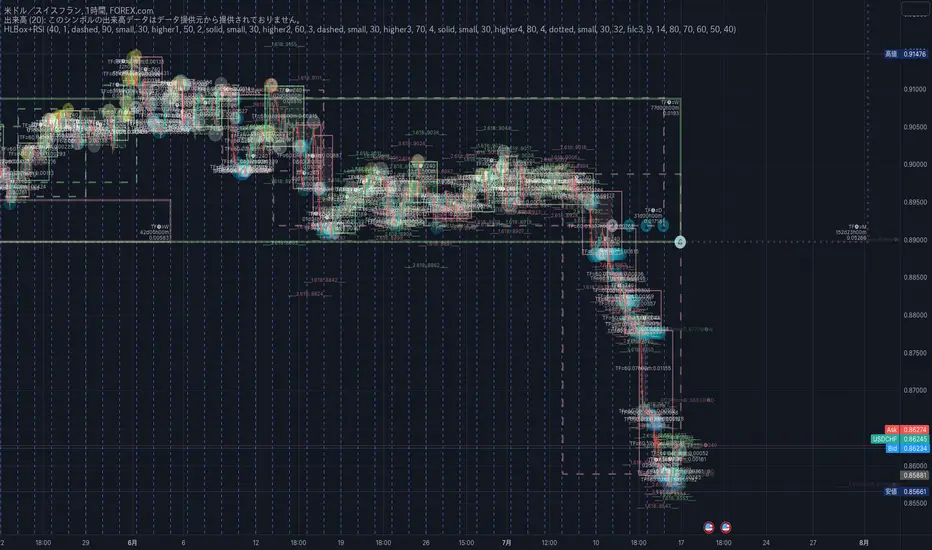
Enclose in a square high and low range in each timeframe.
Shows price range and duration of each box.
In current timeframe, shows Fibonacci Scale inside(23.6%, 38.2%, 50.0%, 61.8%, 76.4%)/outside of each box.
Outside(161.8%,261.8,361.8%) would be shown as next target, if break top/bottom of each box.
Shows price range and duration of each box.
In current timeframe, shows Fibonacci Scale inside(23.6%, 38.2%, 50.0%, 61.8%, 76.4%)/outside of each box.
Outside(161.8%,261.8,361.8%) would be shown as next target, if break top/bottom of each box.
- 1st box for current timeframe.(default: Chart)
- 2nd-4th box for higher timeframes.(default: higher1,higher2,higher3)
- static timeframes can also be used.
เอกสารเผยแพร่
Added labels for the narrow range(top/bottom) of recent price action in fibonacci level of higher timeframe range.เอกสารเผยแพร่
Digit after decimal point is changed.(#.000->#.0000)Minor fixes for handling arrays.
Added High Low box minimap.(experimental. default:false)
เอกสารเผยแพร่
Added 4th HTFbox(default: false).Minor color adjustment.
Fixed bugs around initial value of arrays("D" or higher timeframe's box was not shown).
เอกสารเผยแพร่
Added RSI Signal IndicatorRSI Signals are shown at the bottom(RSI<30) or the top(RSI>70) of HighLowBox in each timeframe.
To disable RSI: uncheck RSI checkboxes from bottom part of configuration panel.
RSI Signal is color coded by RSI9 and RSI14 in each timeframe.
In case RSI<=30,
- Location: bottom of the HighLowBox
- white: only RSI9 is <=30
- aqua: RSI9 and RSI14 are <=30 and RSI9<RSI14
- blue: RSI9 and RSI14 are <=30 and RSI9>RSI14
- green: only RSI14 is <=30
In case RSI>=70,
- Location: top of the HighLowBox
- white: only RSI9 is >=70
- yellow: RSI9 and RSI14 are >=70 and RSI9>RSI14
- orange: RSI9 and RSI14 are >=70 and RSI9<RSI14
- red: only RSI14 is >=70
เอกสารเผยแพร่
Renamed."HighLowBox 1+3TF" -> "HighLowBox HTF+RSI"
Fixes
- HighLowBox @tf4 was same as @tf3.
- Set symbol "➊➋➌➍" for tf1-4.
- Plot RSI signal if only when value is updated.
สคริปต์โอเพนซอร์ซ
ด้วยเจตนารมณ์หลักของ TradingView ผู้สร้างสคริปต์นี้ได้ทำให้เป็นโอเพนซอร์ส เพื่อให้เทรดเดอร์สามารถตรวจสอบและยืนยันฟังก์ชันการทำงานของมันได้ ขอชื่นชมผู้เขียน! แม้ว่าคุณจะใช้งานได้ฟรี แต่โปรดจำไว้ว่าการเผยแพร่โค้ดซ้ำจะต้องเป็นไปตาม กฎระเบียบการใช้งาน ของเรา
คำจำกัดสิทธิ์ความรับผิดชอบ
ข้อมูลและบทความไม่ได้มีวัตถุประสงค์เพื่อก่อให้เกิดกิจกรรมทางการเงิน, การลงทุน, การซื้อขาย, ข้อเสนอแนะ หรือคำแนะนำประเภทอื่น ๆ ที่ให้หรือรับรองโดย TradingView อ่านเพิ่มเติมใน ข้อกำหนดการใช้งาน