OPEN-SOURCE SCRIPT
Return & Drawdown
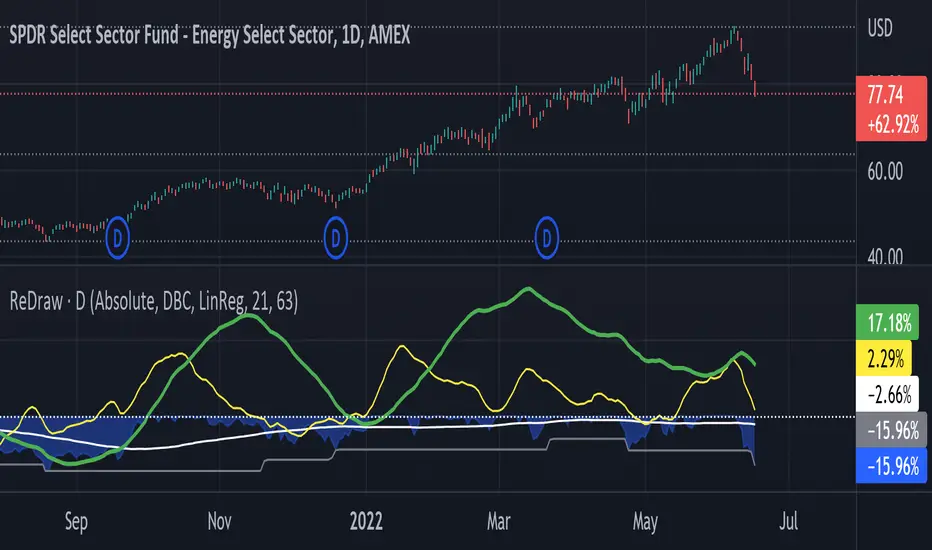
ReDraw script calculates the historical returns and drawdown for the given periods.
By default, the return of the linear regression trends is displayed (can be turned off in settings). In this mode, two linear regression trends are being computed for both long and short periods, and the percent value indicates the "return of the trend" for the corresponding period. Observing the dynamic of the linear regression trends can give a great hint if the trend is slowing down.
When the smoothing method is set to "none" or WMA3/5, the real asset return is shown for both periods, using the formula (LastPrice-FirstPrice)/FirstPrice
The script calculates the maximum drawdown for the long period using the formula (max(Price) - LastPrice) / max(Price).
The white line under the zero is the average maximum drawdown over the long period.
When the mode is set to Compare, ReDraw will display the difference in metrics between the current and selected symbol (SPY by default).
สคริปต์โอเพนซอร์ซ
ด้วยเจตนารมณ์หลักของ TradingView ผู้สร้างสคริปต์นี้ได้ทำให้เป็นโอเพนซอร์ส เพื่อให้เทรดเดอร์สามารถตรวจสอบและยืนยันฟังก์ชันการทำงานของมันได้ ขอชื่นชมผู้เขียน! แม้ว่าคุณจะใช้งานได้ฟรี แต่โปรดจำไว้ว่าการเผยแพร่โค้ดซ้ำจะต้องเป็นไปตาม กฎระเบียบการใช้งาน ของเรา
คำจำกัดสิทธิ์ความรับผิดชอบ
ข้อมูลและบทความไม่ได้มีวัตถุประสงค์เพื่อก่อให้เกิดกิจกรรมทางการเงิน, การลงทุน, การซื้อขาย, ข้อเสนอแนะ หรือคำแนะนำประเภทอื่น ๆ ที่ให้หรือรับรองโดย TradingView อ่านเพิ่มเติมใน ข้อกำหนดการใช้งาน