OPEN-SOURCE SCRIPT
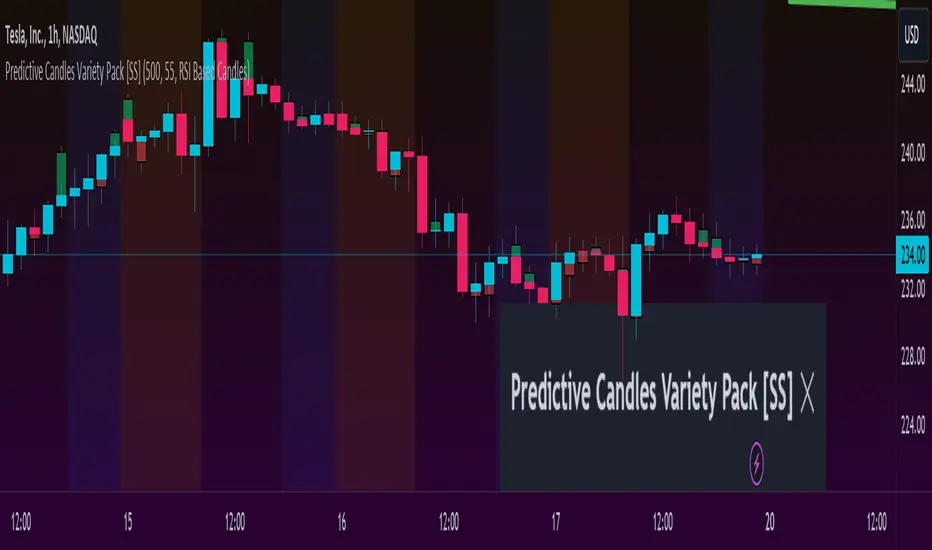
Predictive Candles Variety Pack [SS]

This indicator provides you with the ability to select from a variety of candle prediction methods.
It permits for:
👉 Traditional Linear Regression Candle Predictions
👉 Candle Predictions based on the underlying Stochastics
👉 Candle Predictions based on the underlying RSI
👉 Candle Predictions based on the underlying MFI
👉 Candle Predictions based on the EMA 9
👉 Candle Predictions based on ARIMA modelling
Which is best?
Each method serves its unique purpose.
Here are some general tips of which candles are better suited for what:
🎯Trend Following🎯
For Trend following, the EMA 9 would be an appropriate choice of candle as it helps you to identify the current trend and potential early pullbacks/reversals.
🎯Momentum Following🎯
Momentum following is best carried out with the Stochastics Candles.
🎯Pullback Determination🎯
Pullback Determination is best accomplished through the RSI candles, as the ranges compress or expand based on the current state of oversold/overboughtness.
🎯Detrended Range🎯
To see the detrended range of where the ticker should be falling, absent the trendy noise, it's best to use the ARIMA candles.
Other Features
👉 Other features include a Backtest option that can be toggled on or off and will backtest over the length of the assessment. I don't recommend leaving it on as it can be resource-heavy on Pinescript though.
👉 The ability to adjust the transparency of the candles if you want them to be more or less visible.
Troubleshooting Note
The ARIMA modeling version is extremely resource-heavy, as it has to fully develop an ARIMA model. I have tried to optimize it by reducing the lagged assessment to just 2 lags. If you are using a free or non-premium membership, you may need to reduce the length of the assessment.
And that's it! Pretty straightforward indicator.
Hope you enjoy it!
สคริปต์โอเพนซอร์ซ
ด้วยเจตนารมณ์หลักของ TradingView ผู้สร้างสคริปต์นี้ได้ทำให้เป็นโอเพนซอร์ส เพื่อให้เทรดเดอร์สามารถตรวจสอบและยืนยันฟังก์ชันการทำงานของมันได้ ขอชื่นชมผู้เขียน! แม้ว่าคุณจะใช้งานได้ฟรี แต่โปรดจำไว้ว่าการเผยแพร่โค้ดซ้ำจะต้องเป็นไปตาม กฎระเบียบการใช้งาน ของเรา
Get:
- Live Updates,
- Discord access,
- Access to my Proprietary Merlin Software,
- Access to premium indicators,
patreon.com/steversteves
Now on X!
- Live Updates,
- Discord access,
- Access to my Proprietary Merlin Software,
- Access to premium indicators,
patreon.com/steversteves
Now on X!
คำจำกัดสิทธิ์ความรับผิดชอบ
ข้อมูลและบทความไม่ได้มีวัตถุประสงค์เพื่อก่อให้เกิดกิจกรรมทางการเงิน, การลงทุน, การซื้อขาย, ข้อเสนอแนะ หรือคำแนะนำประเภทอื่น ๆ ที่ให้หรือรับรองโดย TradingView อ่านเพิ่มเติมใน ข้อกำหนดการใช้งาน