OPEN-SOURCE SCRIPT
ที่อัปเดต: Center of Candle Trendline

### **Center of Candle Trendline**
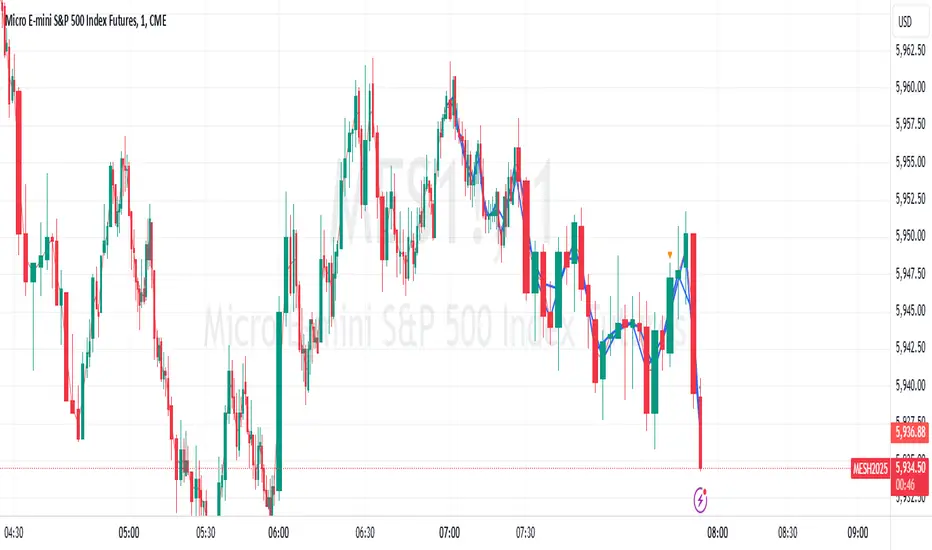
This script dynamically plots a trendline through the center of each candlestick's body. The "center" is calculated as the average of the open and close prices for each candle. The trendline updates in real-time as new candles form, providing a clean and straightforward way to track the market's midline movement.
#### **Features:**
1. **Dynamic Trendline:** The trendline connects the center points of consecutive candlestick bodies, giving a clear visual representation of price movements.
2. **Accurate Center Calculation:** The center is determined as `(open + close) / 2`, ensuring the trendline reflects the true midpoint of each candlestick body.
3. **Real-Time Updates:** The trendline updates automatically as new bars form, keeping your chart up to date with the latest price action.
4. **Customization-Ready:** Adjust the line’s color, width, or style easily to fit your chart preferences.
#### **How to Use:**
- Add this script to your chart to monitor the price movement relative to the center of candlestick bodies.
- Use the trendline to identify trends, reversals, or price consolidation zones.
#### **Applications:**
- **Trend Analysis:** Visualize how the market trends around the center of candlesticks.
- **Reversal Identification:** Detect potential reversal zones when the price deviates significantly from the trendline.
- **Support and Resistance Zones:** Use the trendline as a dynamic support or resistance reference.
This tool is perfect for traders who want a clean and minimalistic approach to tracking price action. Whether you're a beginner or an experienced trader, this script provides valuable insights without overwhelming your chart.
#### **Note:**
This is not a standalone trading strategy but a visual aid to complement your analysis. Always combine it with other tools and techniques for better trading decisions.
---
Feel free to tweak this description based on your preferences or style!
เอกสารเผยแพร่
removed extra blue lineสคริปต์โอเพนซอร์ซ
ด้วยเจตนารมณ์หลักของ TradingView ผู้สร้างสคริปต์นี้ได้ทำให้เป็นโอเพนซอร์ส เพื่อให้เทรดเดอร์สามารถตรวจสอบและยืนยันฟังก์ชันการทำงานของมันได้ ขอชื่นชมผู้เขียน! แม้ว่าคุณจะใช้งานได้ฟรี แต่โปรดจำไว้ว่าการเผยแพร่โค้ดซ้ำจะต้องเป็นไปตาม กฎระเบียบการใช้งาน ของเรา
คำจำกัดสิทธิ์ความรับผิดชอบ
ข้อมูลและบทความไม่ได้มีวัตถุประสงค์เพื่อก่อให้เกิดกิจกรรมทางการเงิน, การลงทุน, การซื้อขาย, ข้อเสนอแนะ หรือคำแนะนำประเภทอื่น ๆ ที่ให้หรือรับรองโดย TradingView อ่านเพิ่มเติมใน ข้อกำหนดการใช้งาน
สคริปต์โอเพนซอร์ซ
ด้วยเจตนารมณ์หลักของ TradingView ผู้สร้างสคริปต์นี้ได้ทำให้เป็นโอเพนซอร์ส เพื่อให้เทรดเดอร์สามารถตรวจสอบและยืนยันฟังก์ชันการทำงานของมันได้ ขอชื่นชมผู้เขียน! แม้ว่าคุณจะใช้งานได้ฟรี แต่โปรดจำไว้ว่าการเผยแพร่โค้ดซ้ำจะต้องเป็นไปตาม กฎระเบียบการใช้งาน ของเรา
คำจำกัดสิทธิ์ความรับผิดชอบ
ข้อมูลและบทความไม่ได้มีวัตถุประสงค์เพื่อก่อให้เกิดกิจกรรมทางการเงิน, การลงทุน, การซื้อขาย, ข้อเสนอแนะ หรือคำแนะนำประเภทอื่น ๆ ที่ให้หรือรับรองโดย TradingView อ่านเพิ่มเติมใน ข้อกำหนดการใช้งาน