OPEN-SOURCE SCRIPT
ที่อัปเดต: Crash Stats 15m (ETH) — X% | prev RTH min(VWAP, Close)
# Crash Stats 15m (ETH) — X% Drawdown Event Analyzer
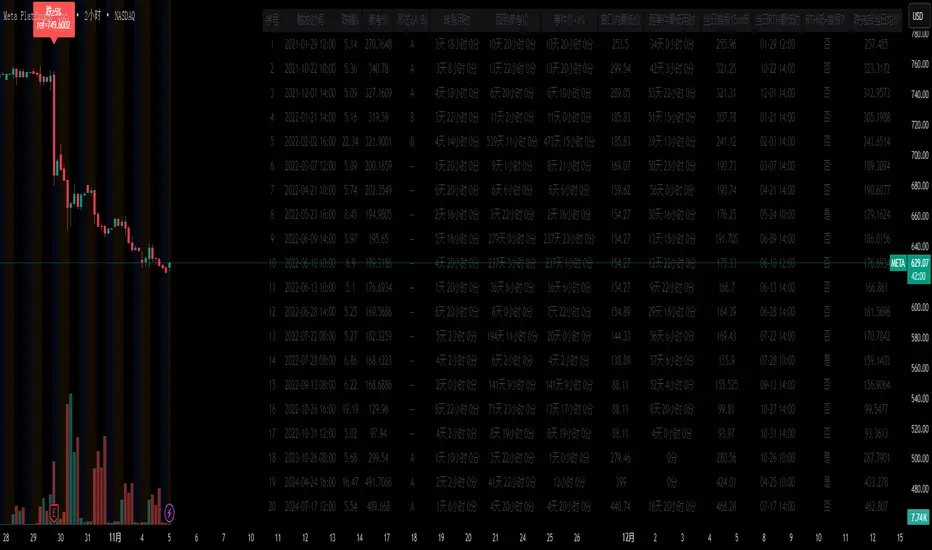
A 15-minute indicator that scans up to the last 5 years to find **crash events** where the close falls by at least **X%** relative to the **lower of** the prior day’s **RTH VWAP** and **RTH close**. It then measures recovery and follow-through behavior, tags the market regime around each event, and summarizes everything in a table.
---
## What the script detects
**Crash event (trigger):**
* On a 15-minute bar, `close <= refPrice * (1 - X%)`.
* `refPrice = min(previous RTH VWAP, previous RTH close)`.
* First touch only: subsequent bars below the threshold on the same trading day are ignored.
* Extended hours (ETH) are supported; if ETH is off, the script safely infers the previous RTH reference.
**Per-event measurements**
1. **Time to “turn up”** – first close **above the event-anchored AVWAP** (AVWAP cumulated from the trigger bar onward).
2. **Time to recover the reference price** – first close ≥ `refPrice`.
3. **Time to recover Y% above the crash-day average price** – first close ≥ `crashDayVWAP * (1+Y%)`.
4. **Post-crash lowest price & timing** – the lowest low and how long after the event it occurs, within a user-defined horizon (default 10 trading days, approximated in calendar days).
5. **Intraday RTH low timing** – on the crash day’s RTH session, when did the day’s intraday low occur, and **was it on the first 15-minute bar**?
6. **First 15-minute low of the RTH day** – recorded for context.
All durations are shown as **D days H hours M minutes**.
---
## Regime tagging (A / B)
For each event the script classifies the surrounding trend using daily closes:
* Let `r6m = (prevClose – close_6mAgo) / close_6mAgo`,
`r12m = (prevClose – close_12mAgo) / close_12mAgo`.
* **A**: both `r6m > 0` and `r12m > 0` (uptrend across 6m & 12m).
* **B**: one positive, one negative, and `r6m + r12m ≥ 0` (mixed but net non-negative).
* Otherwise: **—**.
This helps separate selloffs in strong uptrends (A) from mixed regimes (B) and others.
---
## Inputs
* **X — Crash threshold (%)**: default 5.
* **Y — Recovery above crash-day average (%)**: default 5.
* **Lookback years**: default 5 (bounded by data availability).
* **Horizon for post-crash lowest (trading days)**: default 10 (approximated as calendar days).
* **RTH session**: default `09:30–16:00` (exchange timezone).
* **Show markers**: plot labels on triggers.
* **Rows to display**: last N events in the table.
---
## Table columns
* Index, **Trigger time**, **Drop %**, **Ref price**, **Regime (A/B/—)**
* **Time to turn up** (above anchored AVWAP)
* **Time to ref price**, **Time to day VWAP + Y%**
* **Window lowest price**, **Time to window low**
* **RTH first-15m low**, **RTH lowest time**, **Was RTH low on first 15m?**
* **Crash-day VWAP**
---
## How to use
1. **Set chart to 15-minute** and **enable extended hours** for equities (recommended).
2. Keep defaults (**X=5%, Y=5%**) to start; tighten to 3–4% for more frequent events on less volatile symbols.
3. For non-US symbols or futures, adjust the **RTH session** if needed.
4. Read the table (top-right) for per-event diagnostics and aggregate averages (bottom row).
---
## Notes & implementation details
* Works whether ETH is on or off. If ETH is off, the script back-fills “previous RTH” references at the next RTH open and uses the prior daily close as a fallback.
* The “turn up” definition uses **event-anchored AVWAP**, a robust, price–volume anchor widely used for post-shock mean reversion analysis.
* Events are **de-duplicated**: only one event per trading day (per target RTH cycle).
* Lookback is limited by your plan and the data vendor. The script requests deep history (`max_bars_back=50000`), but availability varies by symbol.
* Durations use minute precision and are rendered as **days–hours–minutes** for readability.
---
## Quick troubleshooting
* **No events found**: lower **X%**, enable **ETH**, or ensure sufficient history is loaded (scroll back, or briefly switch to a higher timeframe to force deeper backfill, then return to 15m).
* **RTH boundaries off**: check the **RTH session** input matches the venue.
* **Few rows in table**: increase **Rows to display**.
---
## Typical use cases
* Back-test how fast different symbols tend to stabilize after a sharp gap-down or intraday shock.
* Compare recovery behavior across regimes **A / B** for sizing and risk timing.
* Build playbooks: e.g., if the RTH low occurs on the first 15m bar X% of the time, plan entries accordingly.
---
## Changelog
* **v1.0**: Initial public release with crash detection, anchored-AVWAP reversal, reference & VWAP+Y recovery timers, regime tagging, window-low timing, RTH low timing, and first-15m low capture.
เอกสารเผยแพร่
# Crash Stats 15m (ETH) – Publication NotesA 15-minute scanner that finds historical crash events and measures how prices recover. It works on both RTH and ETH, and is designed for repeatable, exportable research.
## What it detects
An event is triggered when the 15-minute close falls by at least X% versus the reference price:
* Reference = min(previous RTH VWAP, previous RTH close).
* Default X = 5%.
* Events are de-duplicated: at most one event per trading day.
## What it measures (per event)
1. Time to turn up
First 15-minute bar where both conditions hold:
* Close > previous day’s close, and
* Today’s natural-day VWAP > previous day’s natural-day VWAP.
2. Time to reclaim reference price
First close ≥ the reference price defined above.
3. Time to recover Y% from the event base
* Event base = the event bar’s close.
* If the event occurs in ETH and the option is enabled, the base is updated to the lowest low observed until the next RTH open (captures “post-crash final dip”).
* Target = base × (1 + Y%). Default Y = 5%.
4. Post-crash window low
Lowest price and its time within a user-set window (approx. N trading days, implemented with natural days). Default window = 10 days.
5. RTH intraday extremes on the crash day
* First 15-minute bar’s low.
* RTH session’s lowest price and its timestamp.
* Boolean: did the RTH low occur on the first 15-minute bar?
6. Regime label (A/B) at the time of crash
* A: 6-month return > 0 and 12-month return > 0 (using the prior day’s closes).
* B: one positive and one negative, with (6m + 12m) ≥ 0.
* Else: —.
## Inputs
* X — Drop threshold (%) [default 5.0]
* Y — Recovery from event base (%) [default 5.0]
* Lookback years [default 5]
* Post-crash window (trading days) [default 10]
* RTH session time [default 09:30–16:00 exchange time]
* Show markers on chart [on]
* Table rows to display [default 40]
* Y% base update in ETH [on]
* Export settings:
* Enable export via Data Window
* Persist one bar (keeps values one extra bar to make Export easier)
* Optional: snapshot-to-alert/Webhook chunks (CSV)
## Table columns
* ID
* Trigger time (exchange time)
* Drop% (vs reference)
* Reference price
* Regime (A/B/—)
* Time to turn up
* Time to reference
* Time to Y% recovery (from event base; ETH base trailing if enabled)
* Window low (price)
* Time to window low
* First 15m low (crash day)
* RTH low time (crash day)
* RTH low is first-15m?
* Crash-day natural-day VWAP (for context)
Times are shown as d h m in the on-chart table; exported values are in minutes.
## ETH/RTH handling
* Reference uses the previous RTH only.
* Event detection runs on all bars (ETH included).
* If the crash occurs in ETH and the option is on, the Y% base trails to the lowest low until the next RTH open, then freezes.
## How to use
1. Add to a 15-minute chart. For ETH analysis, enable Extended Hours in TradingView.
2. Set X/Y, lookback years, post-crash window, and RTH session to match the venue.
3. Read the table for the last N events; markers show trigger bars.
4. For CSV:
* Turn on Enable export (Data Window).
* Use TradingView’s Export chart data; the series are named exp_*.
* Or enable snapshot-to-alert to push a full CSV via Any alert() function call.
## Notes and limits
* 15-minute resolution is assumed for triggers and timing. You can view on other timeframes, but precision is anchored to 15m closes.
* Post-crash window approximates trading days with natural days; ±1 day drift is possible on illiquid symbols/holidays.
* Backfill of previous-RTH reference is handled whether ETH is on or off.
* Historical depth depends on your data plan; some symbols may not have full 5-year 15m history.
## Interpretation tips
* A vs B regimes often split “crashes in uptrends” vs “mixed/transition regimes.” Compare average times across regimes.
* The ETH trailing-low base is useful for after-hours dumps; disable it if you prefer a strictly event-bar-close baseline.
* Combine with volatility or liquidity filters when comparing symbols.
## Change log (current)
* Turn-up definition changed to Close > prior day’s Close and Today VWAP > prior day VWAP.
* Y% recovery now uses event base; optional ETH trailing-low until next RTH.
* Added first-15m low, RTH low timing/flag, regime labels, and robust export paths.
* De-duplicate events within one trading day.
If you want, I can add a short, punchy marketplace blurb and screenshots checklist to go with this.
เอกสารเผยแพร่
# Crash Stats 15m (ETH) — Publication NotesA 15-minute research tool that finds historical crash events and measures how prices recover across ETH and RTH. Built for reproducible stats and export.
# What it detects
An event triggers when the 15-minute close falls by at least X% versus the reference price:
* Reference price = min(previous RTH VWAP, previous RTH close).
* Default X = 5%.
* De-duplication: at most one event per trading day.
# What it measures per event
1. Time to turn up
First 15-minute bar where both hold:
* Close > prior day’s close, and
* Today’s natural-day VWAP > prior day’s natural-day VWAP.
2. Time to reclaim reference
First close ≥ reference price.
3. Time to recover Y% from the event base
* Base = event bar’s close.
* If the event is in ETH and the option is enabled, the base trails to the lowest low until the next RTH open, then freezes.
* Target = base × (1 + Y%), default Y = 5%.
4. Post-crash window low
Lowest price and its timestamp within a user window (approx. N trading days, implemented with natural days). Default = 10.
5. RTH intraday extremes on the crash day
* First 15-minute bar low.
* RTH session lowest price and its timestamp.
* Flag: did the RTH low occur on the first 15-minute bar.
6. Regime label at crash time
* A: 6-month return > 0 and 12-month return > 0 (using prior-day closes).
* B: one positive and one negative, with 6m + 12m ≥ 0.
* Else: —.
7. Post-dip same-day average price
Average price from the dip-base timestamp to that natural day’s end (VWAP from base-time to 24:00). Matches the Y% base logic, including ETH trailing until next RTH if enabled.
# Inputs
* X: drop threshold percent (default 5.0)
* Y: recovery from event base percent (default 5.0)
* Lookback years (default 5)
* Post-crash window length in trading days (default 10)
* RTH session time (default 09:30–16:00, exchange time)
* Show chart markers (on)
* Table rows to display (default 40)
* ETH base trailing for Y% (on)
* Export options
* Data Window export (numeric exp_* series)
* Snapshot-to-alert/Webhook CSV (time strings consistent with the on-chart table)
# Table columns
* ID
* Trigger time (exchange time)
* Drop% (vs reference)
* Reference price
* Regime (A/B/—)
* Time to turn up
* Time to reference
* Time to Y% recovery
* Window low (price)
* Time to window low
* First 15m low (crash day)
* RTH low time (crash day)
* RTH low is first-15m
* Post-dip same-day average price
On-chart times are rendered as d h m. Webhook CSV uses the same human-readable format; Data Window export uses minutes for machine use.
# ETH/RTH handling
* Reference uses previous RTH only.
* Detection runs on all bars.
* For ETH events with trailing enabled, the Y% base and the dip-base timestamp update to the lowest low until the next RTH open; post-dip average then freezes for that natural day.
# How to use
1. Add on a 15-minute chart; enable Extended Hours for ETH.
2. Set X, Y, lookback, window, and RTH session for the venue.
3. Read the table for the last N events; markers show triggers.
4. Export
* Data Window: enable export, use TradingView’s Export chart data to get exp_* numeric series.
* Webhook: enable snapshot export, create an alert with Any alert() function call to receive full CSV chunks containing table-style time strings and postdip_avg.
# Notes and limits
* Precision is anchored to 15-minute closes.
* Window uses natural days to approximate trading days; ±1 day drift is possible around holidays/illiquid symbols.
* Historical depth depends on your data plan; some symbols may not provide full 5-year 15-minute history.
# Interpretation tips
* Compare recovery timings across regimes A vs B to separate crashes in uptrends vs mixed regimes.
* ETH trailing is helpful for after-hours dumps; turn it off if you prefer a strict event-bar baseline.
* Combine with volatility/liquidity filters when comparing symbols.
# Change log (current)
* Turn-up definition switched to close > prior close and today VWAP > prior day VWAP.
* Y% recovery now from event base; optional ETH trailing to next RTH.
* Added post-dip same-day average price and aligned webhook CSV times with the table.
* Added first-15m low, RTH low timing/flag, regime labels, robust export paths, and per-day de-duplication.
Marketplace blurb
A 15-minute ETH/RTH crash scanner that tags X% selloffs, measures multiple recovery clocks, and exports clean stats. Supports ETH trailing bases, regime labeling, window lows, first-15m/RTH lows, and post-dip same-day averages with table-style time formatting.
สคริปต์โอเพนซอร์ซ
ด้วยเจตนารมณ์หลักของ TradingView ผู้สร้างสคริปต์นี้ได้ทำให้มันเป็นโอเพ่นซอร์ส เพื่อให้เทรดเดอร์สามารถตรวจสอบและยืนยันการทำงานของสคริปต์ได้ ขอแสดงความชื่นชมผู้เขียน! แม้ว่าคุณจะสามารถใช้งานได้ฟรี แต่อย่าลืมว่าการเผยแพร่โค้ดซ้ำนั้นจะต้องเป็นไปตามกฎระเบียบการใช้งานของเรา
คำจำกัดสิทธิ์ความรับผิดชอบ
ข้อมูลและบทความไม่ได้มีวัตถุประสงค์เพื่อก่อให้เกิดกิจกรรมทางการเงิน, การลงทุน, การซื้อขาย, ข้อเสนอแนะ หรือคำแนะนำประเภทอื่น ๆ ที่ให้หรือรับรองโดย TradingView อ่านเพิ่มเติมที่ ข้อกำหนดการใช้งาน