OPEN-SOURCE SCRIPT
Quarterly Performance
█ OVERVIEW
The Quarterly Performance indicator is designed to visualise and compare the performance of different Quarters of the year. This indicator explores one of the many calendar based anomalies that exist in financial markets.
In the context of financial analysis, a calendar based anomaly refers to patterns or tendencies that are linked to specific time periods, such as days of the week, weeks of the month, or months of the year. This indicator helps explore whether such a calendar based anomaly exists between quarters.
By calculating cumulative quarterly performance and counting the number of quarters with positive returns, it provides a clear snapshot of whether one set of quarters tends to outperform the others, potentially highlighting a calendar based anomaly if a significant difference is observed.
█ FEATURES
█ HOW TO USE
The Quarterly Performance indicator is designed to visualise and compare the performance of different Quarters of the year. This indicator explores one of the many calendar based anomalies that exist in financial markets.
In the context of financial analysis, a calendar based anomaly refers to patterns or tendencies that are linked to specific time periods, such as days of the week, weeks of the month, or months of the year. This indicator helps explore whether such a calendar based anomaly exists between quarters.
By calculating cumulative quarterly performance and counting the number of quarters with positive returns, it provides a clear snapshot of whether one set of quarters tends to outperform the others, potentially highlighting a calendar based anomaly if a significant difference is observed.
█ FEATURES
- Customisable time window through input settings.
- Tracks cumulative returns for each quarter separately.
- Easily adjust table settings like position and font size via input options.
- Clear visual distinction between quarterly performance using different colours.
- Built-in error checks to ensure the indicator is applied to the correct timeframe.
█ HOW TO USE
- Add the indicator to a chart with a 3 Month (Quarterly) timeframe.
- Choose your start and end dates in the Time Settings.
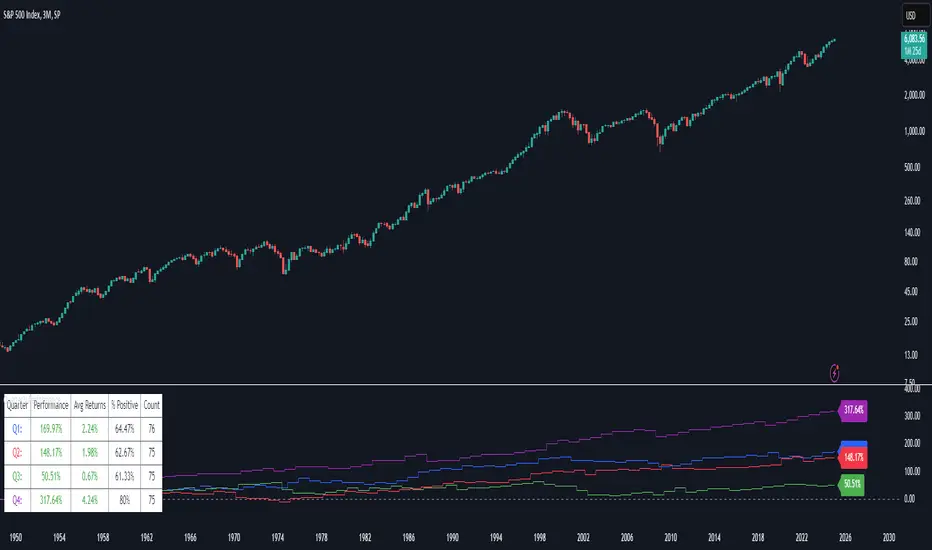
- Enable or disable the performance table in the Table Settings as needed.
- View the cumulative performance, with Q1 in blue, Q2 in red, Q3 in green and Q4 in purple.
สคริปต์โอเพนซอร์ซ
ด้วยเจตนารมณ์หลักของ TradingView ผู้สร้างสคริปต์นี้ได้ทำให้เป็นโอเพนซอร์ส เพื่อให้เทรดเดอร์สามารถตรวจสอบและยืนยันฟังก์ชันการทำงานของมันได้ ขอชื่นชมผู้เขียน! แม้ว่าคุณจะใช้งานได้ฟรี แต่โปรดจำไว้ว่าการเผยแพร่โค้ดซ้ำจะต้องเป็นไปตาม กฎระเบียบการใช้งาน ของเรา
คำจำกัดสิทธิ์ความรับผิดชอบ
ข้อมูลและบทความไม่ได้มีวัตถุประสงค์เพื่อก่อให้เกิดกิจกรรมทางการเงิน, การลงทุน, การซื้อขาย, ข้อเสนอแนะ หรือคำแนะนำประเภทอื่น ๆ ที่ให้หรือรับรองโดย TradingView อ่านเพิ่มเติมใน ข้อกำหนดการใช้งาน