OPEN-SOURCE SCRIPT
ที่อัปเดต: MACD Multi-Timeframe Indicator
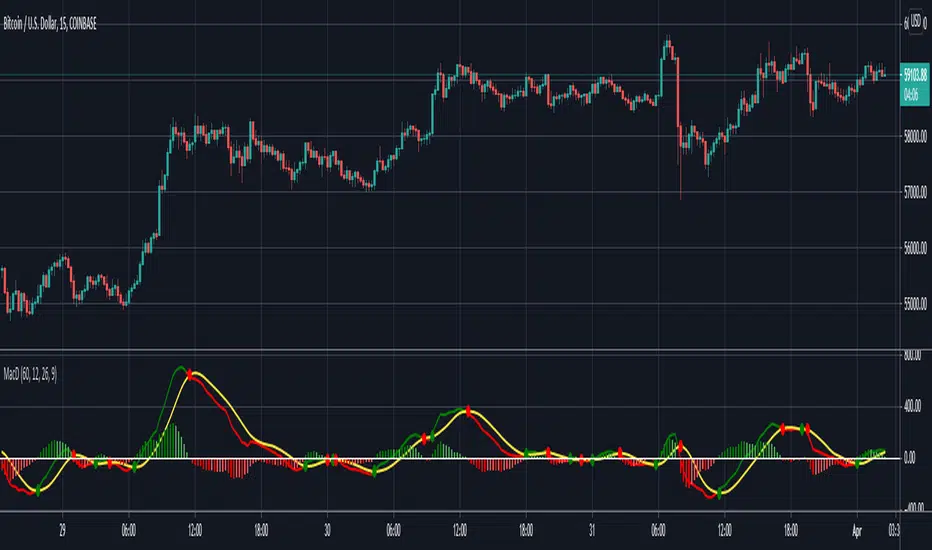
Hello everyone, this is indicator has always been my go-to MACD indicator for many years. It is such a beautiful easy to understand indicator. You can also view different timeframe resolutions which is helpful. When the MACD crosses up the signal line it is green, and when it crosses below the signal line it is red. The signal line is the constant yellow line. MACD histogram is dark green when increasing buying momentum, and you'll see the green get lighter when buy momentum is decreasing. As well, MACD histogram is dark red when increasing sell momentum, and you'll see the red get lighter when sell momentum is decreasing. I hope you guys love this macd design. Happy trading!
The MACD indicator can be used in many ways but my favorite way to use MACD by itself is by going long when macd < 0 & macd crosses above signal line, and going short when macd > 0 & macd crosses below signal line. I added those alerts for anyone interested.
The MACD indicator can be used in many ways but my favorite way to use MACD by itself is by going long when macd < 0 & macd crosses above signal line, and going short when macd > 0 & macd crosses below signal line. I added those alerts for anyone interested.
เอกสารเผยแพร่
I updated the script to version 5 and made the source code more readable to the community.เอกสารเผยแพร่
I fixed the MACD colors so they are more noticeable when MACD momentum is strong or weak.สคริปต์โอเพนซอร์ซ
ด้วยเจตนารมณ์หลักของ TradingView ผู้สร้างสคริปต์นี้ได้ทำให้เป็นโอเพนซอร์ส เพื่อให้เทรดเดอร์สามารถตรวจสอบและยืนยันฟังก์ชันการทำงานของมันได้ ขอชื่นชมผู้เขียน! แม้ว่าคุณจะใช้งานได้ฟรี แต่โปรดจำไว้ว่าการเผยแพร่โค้ดซ้ำจะต้องเป็นไปตาม กฎระเบียบการใช้งาน ของเรา
คำจำกัดสิทธิ์ความรับผิดชอบ
ข้อมูลและบทความไม่ได้มีวัตถุประสงค์เพื่อก่อให้เกิดกิจกรรมทางการเงิน, การลงทุน, การซื้อขาย, ข้อเสนอแนะ หรือคำแนะนำประเภทอื่น ๆ ที่ให้หรือรับรองโดย TradingView อ่านเพิ่มเติมใน ข้อกำหนดการใช้งาน
สคริปต์โอเพนซอร์ซ
ด้วยเจตนารมณ์หลักของ TradingView ผู้สร้างสคริปต์นี้ได้ทำให้เป็นโอเพนซอร์ส เพื่อให้เทรดเดอร์สามารถตรวจสอบและยืนยันฟังก์ชันการทำงานของมันได้ ขอชื่นชมผู้เขียน! แม้ว่าคุณจะใช้งานได้ฟรี แต่โปรดจำไว้ว่าการเผยแพร่โค้ดซ้ำจะต้องเป็นไปตาม กฎระเบียบการใช้งาน ของเรา
คำจำกัดสิทธิ์ความรับผิดชอบ
ข้อมูลและบทความไม่ได้มีวัตถุประสงค์เพื่อก่อให้เกิดกิจกรรมทางการเงิน, การลงทุน, การซื้อขาย, ข้อเสนอแนะ หรือคำแนะนำประเภทอื่น ๆ ที่ให้หรือรับรองโดย TradingView อ่านเพิ่มเติมใน ข้อกำหนดการใช้งาน