OPEN-SOURCE SCRIPT
ที่อัปเดต: Multiple SMAs
Plots multiple SMAs in a single indicator.
This script only plots the SMAs if the timeframe is set to daily.
- SMA10 in light blue
- SMA20 in yellow
- SMA50 in red
- SMA100 in green
- SMA200 in blue
It also plots the crosses between SMA20 and SMA50
This script only plots the SMAs if the timeframe is set to daily.
- SMA10 in light blue
- SMA20 in yellow
- SMA50 in red
- SMA100 in green
- SMA200 in blue
It also plots the crosses between SMA20 and SMA50
เอกสารเผยแพร่
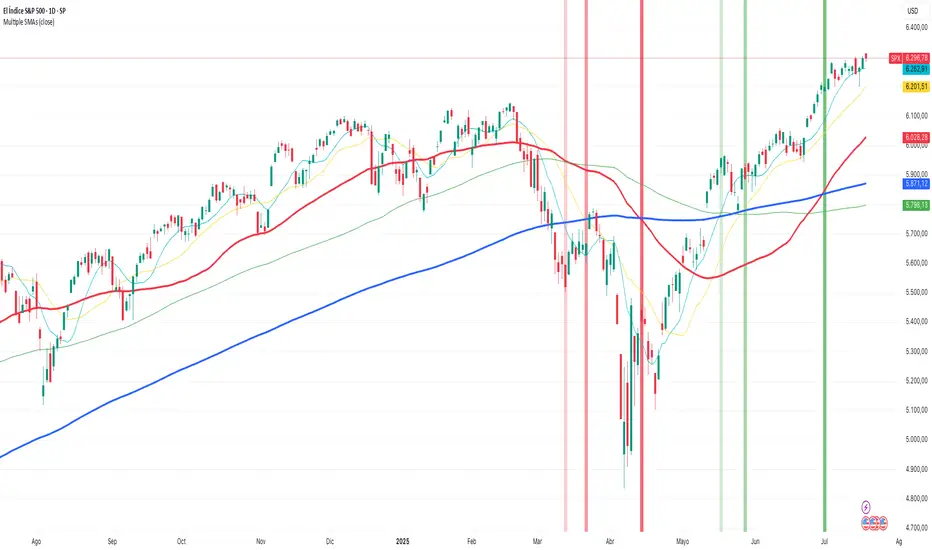
Plots multiple SMAs in a single indicator.This script only plots the SMAs if the timeframe is set to daily, weekly or monthly.
- SMA10 in light blue (daily or weekly)
- SMA20 in yellow (daily or weekly)
- SMA50 in red (daily or weekly)
- SMA100 in green
- SMA200 in blue
It also plots entry and exit alerts,
- Crosses between SMA10 and SMA200 (very light green/red vertical bar)
- Crosses between SMA20 and SMA200 (light green/red vertical bar)
- Crosses between SMA50 and SMA200 (green/red vertical bar)
สคริปต์โอเพนซอร์ซ
ด้วยเจตนารมณ์หลักของ TradingView ผู้สร้างสคริปต์นี้ได้ทำให้เป็นโอเพนซอร์ส เพื่อให้เทรดเดอร์สามารถตรวจสอบและยืนยันฟังก์ชันการทำงานของมันได้ ขอชื่นชมผู้เขียน! แม้ว่าคุณจะใช้งานได้ฟรี แต่โปรดจำไว้ว่าการเผยแพร่โค้ดซ้ำจะต้องเป็นไปตาม กฎระเบียบการใช้งาน ของเรา
คำจำกัดสิทธิ์ความรับผิดชอบ
ข้อมูลและบทความไม่ได้มีวัตถุประสงค์เพื่อก่อให้เกิดกิจกรรมทางการเงิน, การลงทุน, การซื้อขาย, ข้อเสนอแนะ หรือคำแนะนำประเภทอื่น ๆ ที่ให้หรือรับรองโดย TradingView อ่านเพิ่มเติมใน ข้อกำหนดการใช้งาน