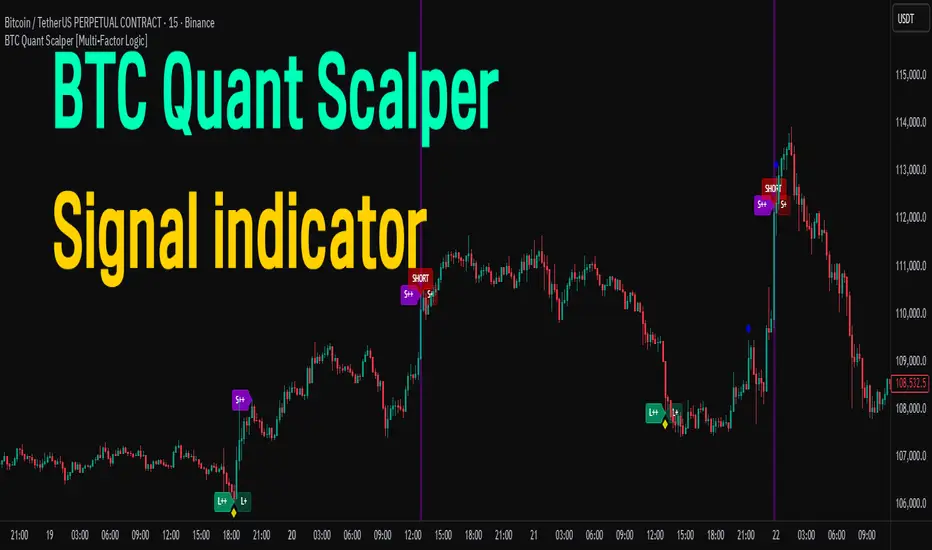
BTC Quant Scalper [Multi-Factor Logic]
This indicator does not simply observe price-based oscillators (such as RSI). Its defining characteristic is its attempt to read the broader market liquidity flow rather than just localized price signals.
- Correlation Analysis:
BTC price and USDT Dominance (USDT.D) generally move inversely. (When investors sell crypto, the proportion of USDT rises.)
This indicator identifies moments when this inverse correlation reaches an extreme (e.g., BTC price extremely overbought while USDT.D is deeply oversold) and interprets them as strong reversal signals.
- Volume Spike Detection:
It does not rely solely on momentum overheating.
A signal triggers only when volume exceeds the `volMult` threshold (default: 3× normal volume), filtering out fake moves lacking real participation.
- RSI & MFI Baseline Adjustment:
All RSI and MFI values are normalized by subtracting 50.
Value > 0: Overbought / bullish zone
Value < 0: Oversold / bearish zone
⚙️General Settings (Configuration Overview)
① Signal Sensitivity (Lv1 ~ Lv4)
Description: Determines how strict the conditions must be for the indicator to trigger a signal. Higher levels apply stricter thresholds for RSI overheating and MFI conditions.
- Lv1 (Sensitive): Captures smaller waves. Useful for reading broad price flow, but can generate frequent signals in sideways markets.
- Lv2 (Standard): Recommended default. Captures typical overbought/oversold zones.
- Lv3 (Strong): Reacts only in clearly overheated conditions (e.g., RSI above 76). More reliable.
- Lv4 (Sniper Mode): Fires only at extreme exhaustion zones (RSI near 80). Rare but highly accurate reversal-level signals.
② Volume Spike Multiplier
- Description: Defines how many multiples above average volume are required to consider it "smart money involvement."
- Usage: Default 2.5 means signals only occur when current volume exceeds 2.5× the 60-candle average.
Increase to 3.0+ to filter noise in high-volatility markets.
In low-liquidity conditions (weekends, early morning), reducing to around 2.0 may be necessary for signals to register.
⚡Symbol Settings (Multi-Factor Inputs)
① BTC Dominance / USDT Dominance
- Description: Market share of Bitcoin and USDT.
- Logic: Used to detect divergence or extreme imbalance between BTC price behavior and USDT.D positioning.
② USDT/KRW (Kimchi Premium Monitoring)
- Description: Reflects the unique characteristics of the Korean market, detecting cases where rapid shifts in USDT/KRW exchange rates influence BTC price behavior.
③ BTC Volume Source
- Description: Select the reference exchange for volume. (Default: Binance Spot)
- Usage: For derivatives-oriented traders, switching to `BINANCE:BTCUSDT.P` ensures the indicator references futures volume instead.
🕯️Pattern Settings (Price Action Pattern Detection)
Controls the long-wick candle pattern displayed on the chart.
① Pattern Timeframe
- Description: Regardless of your visible chart timeframe (e.g., 1-minute), this determines which timeframe is used internally to detect wick patterns.
- Usage: Even if scalping on the 1-minute chart, setting this to 5m or 15m ensures you do not miss larger structural reversal candles (pin bars).
② Big Move Threshold (%)
- Description: Defines the minimum percentage swing required to classify a candle as a "big move."
- Usage: Default 0.8% means the price must swing at least 0.8% beyond the high/low to qualify as a wick pattern.
- High-volatility markets: Increase to 1.2%+ to prevent excessive diamond markers.
- Ranging markets: Reduce to 0.5% so patterns can still be detected.
③ Min BTC Volume
- Description: Minimum BTC volume required for a candle to be considered valid. Prevents false wick signals caused by low-volume “wash trades.”
🎯Detailed Signal Logic
Signals are classified into Lv1 ~ Lv4 depending on strictness.
Higher levels produce fewer signals but with higher reliability.
A. Standard Buy/Sell Signals (RSI/MFI Combination)
The signal strength is determined by a combination of:
Price RSI, USDT.D, BTC.D, KRW rate, and MFI.
Label | Strength | Summary (Sell conditions; Buy is opposite)
- S / L (Weak):
Volume spike + price RSI overheated + one supporting factor (e.g., USDT.D alignment).
An early warning. Can be ignored in strong trends. Suitable for starting partial scaling.
- S+ / L+ (Mid):
Volume spike + price overheating + divergence confirmed in BTC.D or KRW factors.
Standard signal. Typically indicates a short-term pullback or bounce.
- S++ / L++ (Strong):
Volume spike + price RSI overheated + USDT.D oversold (clear inverse-correlation confirmation).
Strong signal indicating participants have “fully bought in,” exhausting cash liquidity.
- SHORT / LONG (Very Strong):
Strong signal + MFI + KRW rate all aligned.
Very high-conviction reversal zone. Primary entry point.
- SHORT★ / LONG★ (Extreme):
All indicators (BTC.D, USDT.D, KRW, MFI, price) reach extreme conditions.
Major trend reversal zone. Marks the end of panic selling or the peak of FOMO buying.
- Diamond (◆) Marker:
Displayed when RSI and MFI simultaneously enter extreme zones.
Represents an early warning—not an immediate reversal signal.
Strong trends may continue even after this signal, so counter-trading immediately is risky.
Best used for partial take-profit or preparing for upcoming reversal confirmation.
B. Special Pattern Signals (Big Move)
These are based on price action + volume, not indicator values.
- Big-L (B-LONG):
Conditions: IsTargetTF & PriceDrop & PriceRecovery & BtcHighVolume
Meaning: Sharp drop followed by strong recovery within a set timeframe (e.g., 5m).
Represents a long lower wick (pin bar) with high volume—smart money stepping in.
- Big-S (B-Short):
Conditions: PriceRise & PriceFallBack & BtcHighVolume
Meaning: Sharp rally followed by a weak close—a shooting-star upper wick.
Indicates aggressive sell-off at the top with volume confirmation.
💡Practical Usage & Trading Strategies
This indicator can be used across scalping, intraday, swing, and broader trend-trading strategies.
- Strategy 1: Reversal Trading – Using ★, SHORT, LONG
The indicator’s strongest application: capturing extreme fear or FOMO.
Entry: Enter at the open of the next candle after a LONG★ or SHORT★ signal.
Watch for background color changes (purple/yellow).
Dual Check: Open USDT.D to confirm support/resistance alignment.
Stop Loss: Exit if price moves −0.5% from entry or breaks the wick high/low of the signal candle.
- Strategy 2: Momentum Exhaustion – Using S++, L++
Used when a strong trend begins to lose momentum.
Existing positions: Ideal for securing profits (take-profit 50–70%).
New entries: Short-term high-leverage countertrades are possible.
Target: Keep conservative targets (+0.5% ~ +1.0%).
- Strategy 3: Pullback Trading – Using S+, L+
Identifies temporary pauses within trends.
Filtering:
In uptrends → only L, L+.
In downtrends → only S, S+.
Big Signal Combo:
L+ + Big-L = high-quality long setup.
S+ + Big-S = high-quality short setup.
- Strategy 4: Wick Trading – Using Big-L, Big-S
Designed for volatile conditions.
Settings: Set targetTF to 5m or 15m.
Entry Logic:
Big-L → Large defensive buy pressure. Enter long using wick low as stop.
Big-S → Aggressive selling. Enter short using wick high as stop.
💎Cautions & Risk Management
- Repainting Risk:
Using `request.security(..., timeframe.period, ...)` with real-time candles may cause signals to flicker before close.
Always wait for candle close.
- Strong One-Way Trending Markets:
During vertical BTC rallies, S/S+/SHORT signals may appear repeatedly while price continues rising (RSI holding 80–90).
Use Lv3+ or wait for divergence before counter-trading.
Avoid counter-trend trades in heavy momentum markets.
- Input Tuning:
alertLevel: Increase to Lv3+ if signals appear too frequently.
volMult: Lower to ~2.0 in quiet markets; raise to 3.0+ in volatile markets.
💬Summary
This indicator identifies moments where volume surges coincide with extreme imbalance or breakdown of inverse correlation between BTC price and USDT dominance.
Trading primarily with Strong (L++, S++), Very Strong (LONG, SHORT), Extreme (LONG★, SHORT★), and Big-Move wick patterns provides high-probability setups.
For successful trading, you must carefully understand the following points and use this indicator not as a tool to blindly rely on, but as a powerful tool to complement your own trading strategy.
1. Limitations of Indicators and the Risk of Blind Trust
This indicator mathematically calculates past data and current market conditions to suggest “high-probability zones”, but it does not predict the future.
* Do not use it alone: No matter how strong a 'SHORT★' signal appears, never blindly commit your entire capital (Full Seed).
* Combine with technical analysis: Always double-check the validity with basic technical analysis such as support and resistance lines, moving averages, and trendlines. Even if the indicator signals a buy, if there is a strong resistance zone above, delay entry or lower your target.
2. Beware of Price Action Traps from News and Fundamental Events
Markets often react more to news and fundamentals than to technical analysis. Sudden price movements caused by these events can invalidate indicator signals.
* Event-Driven Volatility: Unexpected news like CPI releases, FOMC announcements, war developments, exchange hacks, or regulatory actions can make overbought/oversold logic unreliable. Bad news may push RSI below the floor, while good news may skyrocket prices beyond the ceiling.
* Bull/Bear Traps: Smart money often uses news to lure retail traders.
* Bull Trap: Positive news pushes the price up, enticing retail to chase buys, then large players sell at the peak, causing a sharp drop. Even if the indicator signals buy, exercise caution in these zones.
* Bear Trap: Negative news creates fear, triggering panic sells, after which smart money buys at the bottom and prices rebound sharply.
* How to respond: Avoid trading around major economic releases or reduce positions to mitigate volatility risk.
3. Read the Market Context
Indicators only see the “numbers” on the chart. Traders must read the market sentiment.
* Strong one-way trends: In a bull market where Bitcoin continuously makes new highs, short signals may be ignored or result in only brief pullbacks. Avoid counter-trend entries during excessively strong trends.
* Low-volume sideways markets: During weekends or holidays when trading volume is thin, small interventions by smart money can trigger false signals. Increase the Volume Spike Multiplier to strengthen filtering in such cases.
4. Money Management is Key
Even the best setups are worthless without proper capital management.
* Stop Loss is essential: Accept that the indicator can be wrong and always set a stop-loss line when entering a trade (e.g., exit if the candle tail is breached).
* Partial entries and exits: Instead of committing your entire capital at once, divide your entries and secure profits incrementally within the target zone.
You can now configure alerts independently based on signal strength. If you wish to filter and receive only specific signal levels for a target timeframe, please set up individual alerts for each condition.
สคริปต์แบบเฉพาะผู้ได้รับเชิญเท่านั้น
เฉพาะผู้ใช้งานที่ผู้เขียนอนุมัตเท่านั้นจึงจะสามารถเข้าถึงสคริปต์นี้ได้ คุณจะต้องขอและได้รับอนุญาตก่อนใช้งาน ซึ่งโดยทั่วไปจะได้รับอนุญาตหลังจากชำระเงินแล้ว สำหรับรายละเอียดเพิ่มเติม โปรดทำตามคำแนะนำของผู้เขียนด้านล่าง หรือติดต่อ BIGTAKER โดยตรง
TradingView ไม่แนะนำให้จ่ายเงินหรือใช้สคริปต์ เว้นแต่คุณจะเชื่อถือผู้เขียนและเข้าใจวิธีการทำงานของสคริปต์นั้นอย่างถ่องแท้ คุณยังสามารถหาทางเลือกแบบโอเพนซอร์สฟรีได้ใน สคริปต์ชุมชนของเรา
คำแนะนำของผู้เขียน
Coming soon! all-in-one indicators dashboard📊
Please wait for news after follow and boost🚀
We are fully dedicated to developing a system.
Stay tuned for news on FREE early access!🎯
คำจำกัดสิทธิ์ความรับผิดชอบ
สคริปต์แบบเฉพาะผู้ได้รับเชิญเท่านั้น
เฉพาะผู้ใช้งานที่ผู้เขียนอนุมัตเท่านั้นจึงจะสามารถเข้าถึงสคริปต์นี้ได้ คุณจะต้องขอและได้รับอนุญาตก่อนใช้งาน ซึ่งโดยทั่วไปจะได้รับอนุญาตหลังจากชำระเงินแล้ว สำหรับรายละเอียดเพิ่มเติม โปรดทำตามคำแนะนำของผู้เขียนด้านล่าง หรือติดต่อ BIGTAKER โดยตรง
TradingView ไม่แนะนำให้จ่ายเงินหรือใช้สคริปต์ เว้นแต่คุณจะเชื่อถือผู้เขียนและเข้าใจวิธีการทำงานของสคริปต์นั้นอย่างถ่องแท้ คุณยังสามารถหาทางเลือกแบบโอเพนซอร์สฟรีได้ใน สคริปต์ชุมชนของเรา
คำแนะนำของผู้เขียน
Coming soon! all-in-one indicators dashboard📊
Please wait for news after follow and boost🚀
We are fully dedicated to developing a system.
Stay tuned for news on FREE early access!🎯