OPEN-SOURCE SCRIPT
ที่อัปเดต: ORB + Premarket High/Low
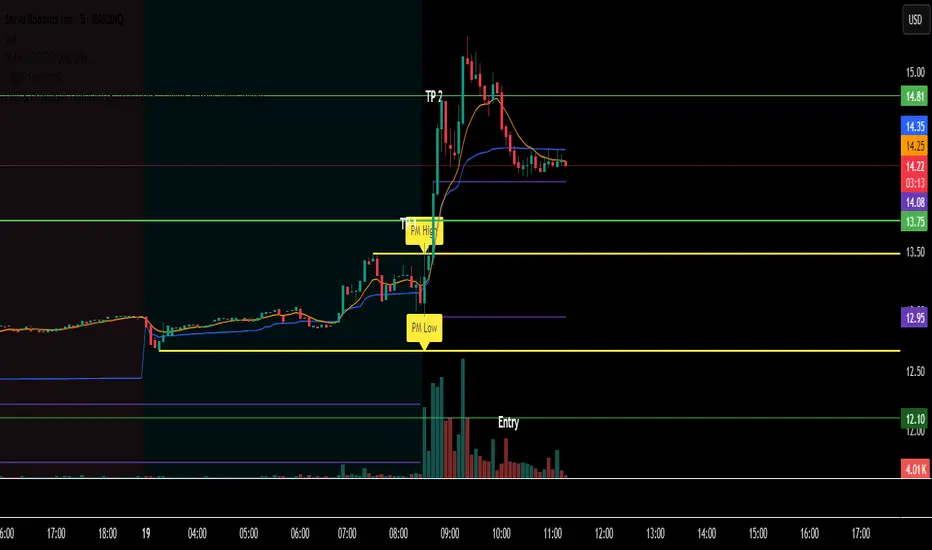
indicator that show opening range break plus premarket highs and lows
เอกสารเผยแพร่
Indicator DescriptionThis indicator is a key part of a trading strategy focused on breakouts and breakdowns. It automatically marks two important price levels:
Premarket High and Low: The indicator identifies the highest and lowest prices reached during the premarket session (4:00 AM to 9:30 AM EST). It then draws these levels as horizontal lines that extend through the rest of the trading day.
Morning Open: It also highlights the first 15 minutes of the regular market open, which is what you use as your "Opening Range Breakout" (ORB) zone. Make sure to change this in settings as 9:30 to 9:45 EST
By clearly plotting these premarket and opening range levels on your chart, this tool helps you visualize key support and resistance zones, which is crucial for trading breakout and breakdown strategies.
สคริปต์โอเพนซอร์ซ
ด้วยเจตนารมณ์หลักของ TradingView ผู้สร้างสคริปต์นี้ได้ทำให้เป็นโอเพนซอร์ส เพื่อให้เทรดเดอร์สามารถตรวจสอบและยืนยันฟังก์ชันการทำงานของมันได้ ขอชื่นชมผู้เขียน! แม้ว่าคุณจะใช้งานได้ฟรี แต่โปรดจำไว้ว่าการเผยแพร่โค้ดซ้ำจะต้องเป็นไปตาม กฎระเบียบการใช้งาน ของเรา
คำจำกัดสิทธิ์ความรับผิดชอบ
ข้อมูลและบทความไม่ได้มีวัตถุประสงค์เพื่อก่อให้เกิดกิจกรรมทางการเงิน, การลงทุน, การซื้อขาย, ข้อเสนอแนะ หรือคำแนะนำประเภทอื่น ๆ ที่ให้หรือรับรองโดย TradingView อ่านเพิ่มเติมใน ข้อกำหนดการใช้งาน