OPEN-SOURCE SCRIPT
ที่อัปเดต: Niteya BG Candle Formations
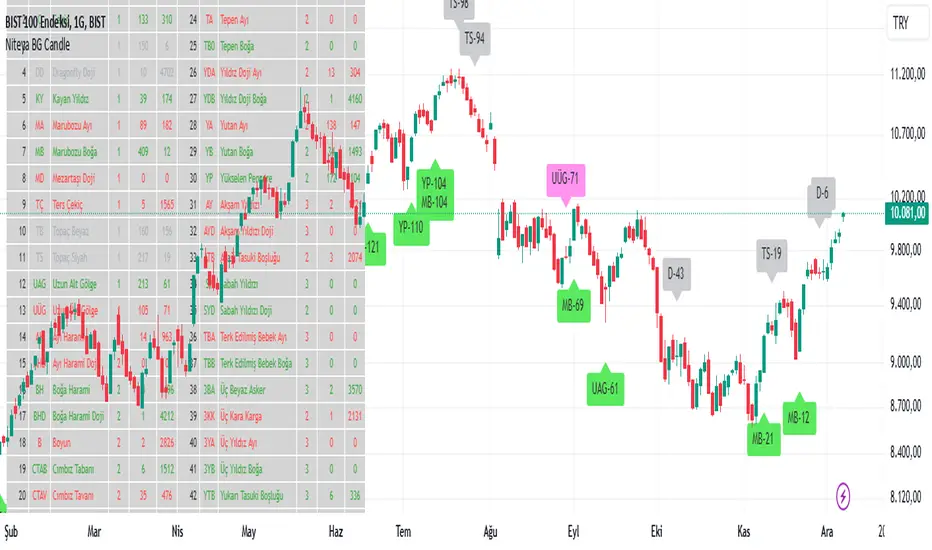
Niteya BG Candle Formations is an indicator that shows the total number of formations of each of the 44 different candlestick formations and the index of the last bar it was formed in a table and on a chart.
It shows candlestick formations that express uptrends and downtrends and indecisive market conditions in different colors.
The table columns contain the values shown below:
S.No: Candlestick formation bar index number
Code: Candlestick formation abbreviation
Formation: Name of the candlestick formation
Quantity: Number of candles in the formation
Total: Total number of formations on the chart
Last: Index of the last formation on the chart
bilgigunlugum.net/public/images/borsa/candlef_1.png
Details
bilgigunlugum.net/borsa/pine_script/pine_script_indicator/candlef
Türkçe açıklaması
Niteya BG Candle Formations, toplam 44 adet farklı mum formasyonunun her birinin toplam oluşma sayısını ve en son oluştuğu barın endeksini bir tabloda ve grafik üzerinde gösteren bir indikatördür.
Yükseliş ve düşüş trendleri ile kararsız piyasa durumlarını ifade eden mum formasyonlarını farklı renkte gösterir.
Tablo sütunları aşağıda gösterilen değerleri içerir:
S.No: Mum formasyonu sıra numarası
Kod: Mum formasyonu kısaltması
Formasyonu: Mum formasyonunun adı
Adet: Formasyonu oluşturan mum sayısı
Toplam: Grafikte gerçekleşen toplam formasyon sayısı
Son: Grafikte gerçekleşen en son formasyon endeksi
bilgigunlugum.net/public/images/borsa/candlef_1.png
Detaylar
bilgigunlugum.net/borsa/pine_script/pine_script_indicator/candlef
เอกสารเผยแพร่
Table and character sizes have been reduced.สคริปต์โอเพนซอร์ซ
ด้วยเจตนารมณ์หลักของ TradingView ผู้สร้างสคริปต์นี้ได้ทำให้เป็นโอเพนซอร์ส เพื่อให้เทรดเดอร์สามารถตรวจสอบและยืนยันฟังก์ชันการทำงานของมันได้ ขอชื่นชมผู้เขียน! แม้ว่าคุณจะใช้งานได้ฟรี แต่โปรดจำไว้ว่าการเผยแพร่โค้ดซ้ำจะต้องเป็นไปตาม กฎระเบียบการใช้งาน ของเรา
คำจำกัดสิทธิ์ความรับผิดชอบ
ข้อมูลและบทความไม่ได้มีวัตถุประสงค์เพื่อก่อให้เกิดกิจกรรมทางการเงิน, การลงทุน, การซื้อขาย, ข้อเสนอแนะ หรือคำแนะนำประเภทอื่น ๆ ที่ให้หรือรับรองโดย TradingView อ่านเพิ่มเติมใน ข้อกำหนดการใช้งาน
สคริปต์โอเพนซอร์ซ
ด้วยเจตนารมณ์หลักของ TradingView ผู้สร้างสคริปต์นี้ได้ทำให้เป็นโอเพนซอร์ส เพื่อให้เทรดเดอร์สามารถตรวจสอบและยืนยันฟังก์ชันการทำงานของมันได้ ขอชื่นชมผู้เขียน! แม้ว่าคุณจะใช้งานได้ฟรี แต่โปรดจำไว้ว่าการเผยแพร่โค้ดซ้ำจะต้องเป็นไปตาม กฎระเบียบการใช้งาน ของเรา
คำจำกัดสิทธิ์ความรับผิดชอบ
ข้อมูลและบทความไม่ได้มีวัตถุประสงค์เพื่อก่อให้เกิดกิจกรรมทางการเงิน, การลงทุน, การซื้อขาย, ข้อเสนอแนะ หรือคำแนะนำประเภทอื่น ๆ ที่ให้หรือรับรองโดย TradingView อ่านเพิ่มเติมใน ข้อกำหนดการใช้งาน