OPEN-SOURCE SCRIPT
Column XO Zone
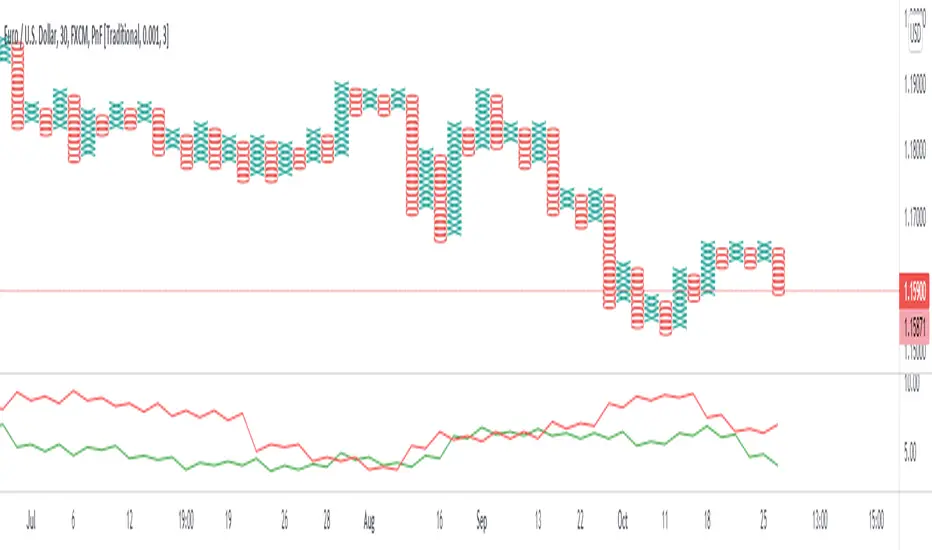
Column XO is an indicator in Prashant Shah's book Trading The Markets The Point & Figure Way. It counts a number of Xs and Os in every column for the length period. Both Xs and Os are calculated separately. Then, both results are divided by half the number of columns which is set by length.
I personally don't find this indicator very useful, because all it can offer is very clear in Point and Figure charts. However, it was designed to give some information on volatility as well as direction.
Good luck!
I personally don't find this indicator very useful, because all it can offer is very clear in Point and Figure charts. However, it was designed to give some information on volatility as well as direction.
Good luck!
สคริปต์โอเพนซอร์ซ
ด้วยเจตนารมณ์หลักของ TradingView ผู้สร้างสคริปต์นี้ได้ทำให้เป็นโอเพนซอร์ส เพื่อให้เทรดเดอร์สามารถตรวจสอบและยืนยันฟังก์ชันการทำงานของมันได้ ขอชื่นชมผู้เขียน! แม้ว่าคุณจะใช้งานได้ฟรี แต่โปรดจำไว้ว่าการเผยแพร่โค้ดซ้ำจะต้องเป็นไปตาม กฎระเบียบการใช้งาน ของเรา
คำจำกัดสิทธิ์ความรับผิดชอบ
ข้อมูลและบทความไม่ได้มีวัตถุประสงค์เพื่อก่อให้เกิดกิจกรรมทางการเงิน, การลงทุน, การซื้อขาย, ข้อเสนอแนะ หรือคำแนะนำประเภทอื่น ๆ ที่ให้หรือรับรองโดย TradingView อ่านเพิ่มเติมใน ข้อกำหนดการใช้งาน