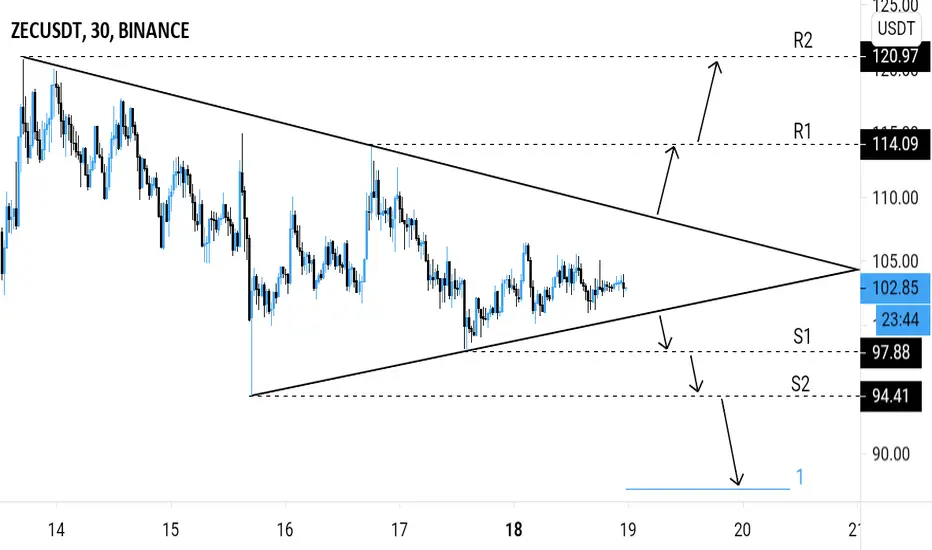
Analysis 🔎: ZENUSDT is consolidating in a symmetrical triangle pattern.
Breakout is imminent.
Bullish ⬆️: breakout above the symmetrical triangle's inclined resistance.
Bearish ⬇️: breakdown below the symmetrical triangle's inclined support.
Possible breakout price actions are indicated by the arrows on the chart.
Targets 🎯: Bullish ⬆️ - horizontal resistance levels (R1, R2).
Bearish ⬇️ - horizontal support levels (S1, S2), fibonacci extension levels.
คำจำกัดสิทธิ์ความรับผิดชอบ
ข้อมูลและบทความไม่ได้มีวัตถุประสงค์เพื่อก่อให้เกิดกิจกรรมทางการเงิน, การลงทุน, การซื้อขาย, ข้อเสนอแนะ หรือคำแนะนำประเภทอื่น ๆ ที่ให้หรือรับรองโดย TradingView อ่านเพิ่มเติมที่ ข้อกำหนดการใช้งาน
คำจำกัดสิทธิ์ความรับผิดชอบ
ข้อมูลและบทความไม่ได้มีวัตถุประสงค์เพื่อก่อให้เกิดกิจกรรมทางการเงิน, การลงทุน, การซื้อขาย, ข้อเสนอแนะ หรือคำแนะนำประเภทอื่น ๆ ที่ให้หรือรับรองโดย TradingView อ่านเพิ่มเติมที่ ข้อกำหนดการใช้งาน