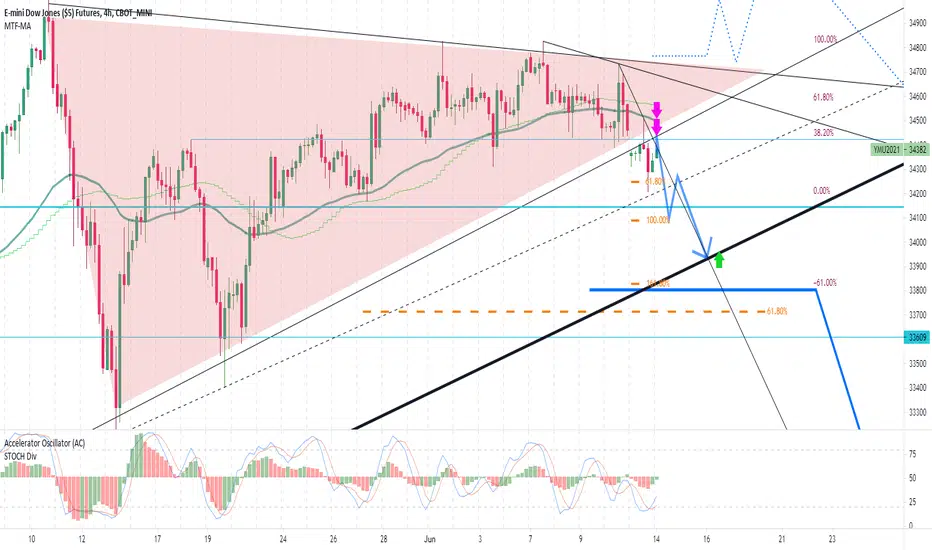
daily chart clearly show sell , we have 2 trend line in down , technical say if dowjones can break them ,down trend will start ,can go to 28500 (big gap on cash phisical dowjones)
tradingview.com/chart/jtsoM2GC/
red arrow=powerfull sellimit place with sl and trailstop= 80
green arrow=buylimit place with sl and trailstop=80
if big trend (daily chart trend line start from corona crash) near 33900 break , you can sell
tradingview.com/chart/jtsoM2GC/
red arrow=powerfull sellimit place with sl and trailstop= 80
green arrow=buylimit place with sl and trailstop=80
if big trend (daily chart trend line start from corona crash) near 33900 break , you can sell
คำจำกัดสิทธิ์ความรับผิดชอบ
ข้อมูลและบทความไม่ได้มีวัตถุประสงค์เพื่อก่อให้เกิดกิจกรรมทางการเงิน, การลงทุน, การซื้อขาย, ข้อเสนอแนะ หรือคำแนะนำประเภทอื่น ๆ ที่ให้หรือรับรองโดย TradingView อ่านเพิ่มเติมใน ข้อกำหนดการใช้งาน
คำจำกัดสิทธิ์ความรับผิดชอบ
ข้อมูลและบทความไม่ได้มีวัตถุประสงค์เพื่อก่อให้เกิดกิจกรรมทางการเงิน, การลงทุน, การซื้อขาย, ข้อเสนอแนะ หรือคำแนะนำประเภทอื่น ๆ ที่ให้หรือรับรองโดย TradingView อ่านเพิ่มเติมใน ข้อกำหนดการใช้งาน