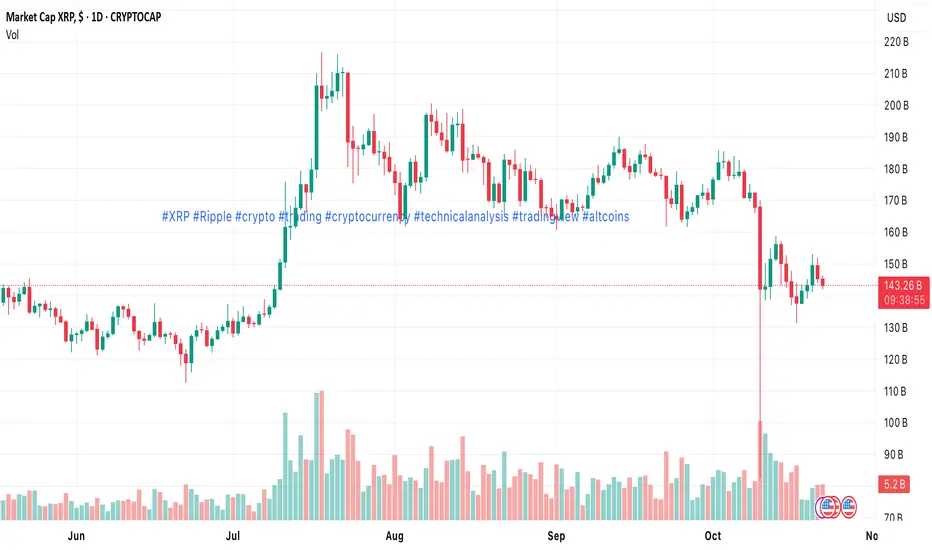
XRP/USD continues to move within a descending channel, confirming a sustained bearish structure. Earlier in the month, the pair attempted to break out above 3.1250 (Murray [8/8]), but the move failed, triggering a renewed selloff as U.S.–China trade tensions escalated and risk appetite faded.
Currently, the pair is hovering near 2.3438 (Murray [4/8]), a critical support level. A clear break below this zone could accelerate the decline toward 1.9531 (Murray [2/8]) and 1.5625 (Murray [0/8]). On the flip side, a recovery above 2.6220–2.7344 (mid-Bollinger Band, Murray [6/8]) would invalidate the bearish structure and open the door to 3.1250 (Murray [8/8]) and 3.5156 (Murray [+2/8]) — though this remains a less likely scenario for now.
⸻
Technical Analysis
• Trend: Still bearish; lower highs confirm downside structure.
• Bollinger Bands: Expanding downward — volatility rising with pressure on the downside.
• MACD: Flat in the negative zone — momentum favors sellers.
• Stochastic: Near overbought — potential for a downside reversal.
On the weekly timeframe, XRP is holding below the midline of the Bollinger Bands, keeping the broader downtrend intact.
⸻
Trading Plan
📉 Sell Setup
• Entry: 2.3435
• Targets: 1.9531 → 1.5625
• Stop-Loss: 2.6500
• Time Horizon: 5–7 days
📈 Buy Setup (Breakout Confirmation)
• Entry: 2.7345
• Targets: 3.1250 → 3.5156
• Stop-Loss: 2.4500
⸻
Key Levels
Support: 2.3438 · 1.9531 · 1.5625
Resistance: 2.7344 · 3.1250 · 3.5156
⸻
💬 XRP remains under bearish pressure. A daily close below 2.34 could confirm another leg down toward 1.95, while only a breakout above 2.73 would shift momentum in favor of the bulls.
คำจำกัดสิทธิ์ความรับผิดชอบ
ข้อมูลและบทความไม่ได้มีวัตถุประสงค์เพื่อก่อให้เกิดกิจกรรมทางการเงิน, การลงทุน, การซื้อขาย, ข้อเสนอแนะ หรือคำแนะนำประเภทอื่น ๆ ที่ให้หรือรับรองโดย TradingView อ่านเพิ่มเติมที่ ข้อกำหนดการใช้งาน
คำจำกัดสิทธิ์ความรับผิดชอบ
ข้อมูลและบทความไม่ได้มีวัตถุประสงค์เพื่อก่อให้เกิดกิจกรรมทางการเงิน, การลงทุน, การซื้อขาย, ข้อเสนอแนะ หรือคำแนะนำประเภทอื่น ๆ ที่ให้หรือรับรองโดย TradingView อ่านเพิ่มเติมที่ ข้อกำหนดการใช้งาน
