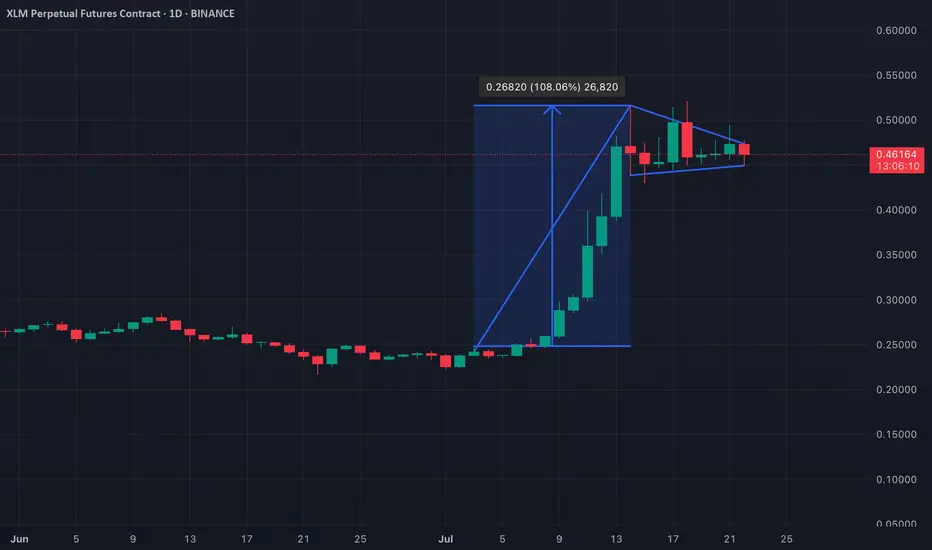
XLM has formed a bullish pennant on the daily chart—a classic continuation pattern that typically follows a strong upward price surge. This formation, marked by a consolidation phase in the shape of a symmetrical triangle, suggests that buyers are briefly pausing before potentially resuming the uptrend.
A breakout above the pennant’s upper trendline would likely confirm bullish momentum, giving traders a clear signal to enter long positions. If this breakout occurs with strong volume, XLM could see an explosive move higher, potentially mirroring the size of the initial flagpole that led into the consolidation. Keep an eye on resistance levels as a break could spark the next leg up.
A breakout above the pennant’s upper trendline would likely confirm bullish momentum, giving traders a clear signal to enter long positions. If this breakout occurs with strong volume, XLM could see an explosive move higher, potentially mirroring the size of the initial flagpole that led into the consolidation. Keep an eye on resistance levels as a break could spark the next leg up.
Full story here beincrypto.com/
คำจำกัดสิทธิ์ความรับผิดชอบ
ข้อมูลและบทความไม่ได้มีวัตถุประสงค์เพื่อก่อให้เกิดกิจกรรมทางการเงิน, การลงทุน, การซื้อขาย, ข้อเสนอแนะ หรือคำแนะนำประเภทอื่น ๆ ที่ให้หรือรับรองโดย TradingView อ่านเพิ่มเติมที่ ข้อกำหนดการใช้งาน
Full story here beincrypto.com/
คำจำกัดสิทธิ์ความรับผิดชอบ
ข้อมูลและบทความไม่ได้มีวัตถุประสงค์เพื่อก่อให้เกิดกิจกรรมทางการเงิน, การลงทุน, การซื้อขาย, ข้อเสนอแนะ หรือคำแนะนำประเภทอื่น ๆ ที่ให้หรือรับรองโดย TradingView อ่านเพิ่มเติมที่ ข้อกำหนดการใช้งาน