A H&S Pattern has formed in the XLK. What does it mean?
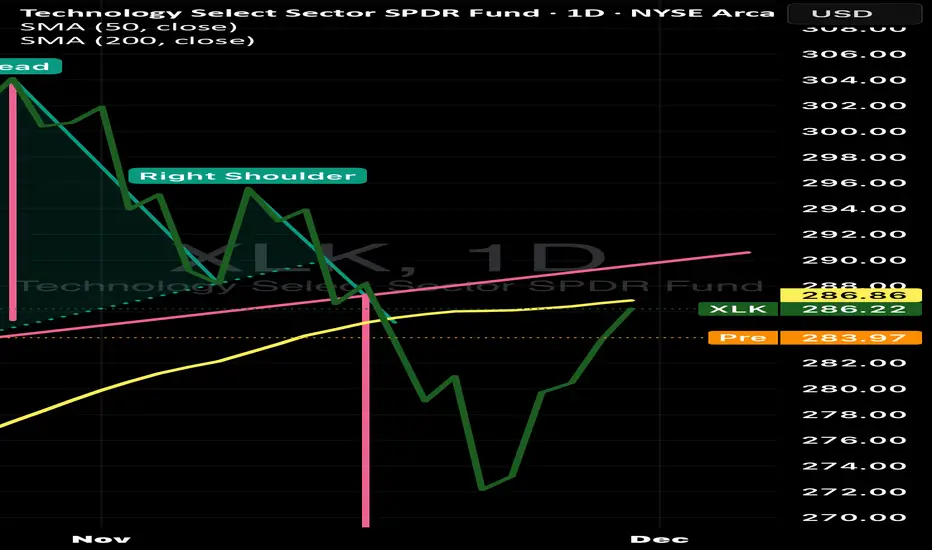
A head-and-shoulders pattern usually signals a potential trend reversal from bullish to bearish.
What to watch (triggers & confirmation)
1. Neckline break on volume — primary sell signal. Wait for a daily close below $283–285 with higher volume for confirmation.
2. Retest behavior — if price breaks and then returns to the neckline and is rejected (fails to reclaim it), that’s a strong continuation signal.
3. Momentum indicators — look for RSI falling below 50 and MACD turning bearish to add confidence.
4. 200-SMA reaction — a bounce there could be a good place to trim or hedge; a break below it strengthens the move toward the $265 measured target.
5. Market breadth / sentiment — if broad market or sector rotation accelerates away from tech, the pattern’s odds rise; if the market rallies, pattern may fail.
Do you agree? Any in contrary’s comments?
คำจำกัดสิทธิ์ความรับผิดชอบ
ข้อมูลและบทความไม่ได้มีวัตถุประสงค์เพื่อก่อให้เกิดกิจกรรมทางการเงิน, การลงทุน, การซื้อขาย, ข้อเสนอแนะ หรือคำแนะนำประเภทอื่น ๆ ที่ให้หรือรับรองโดย TradingView อ่านเพิ่มเติมใน ข้อกำหนดการใช้งาน
คำจำกัดสิทธิ์ความรับผิดชอบ
ข้อมูลและบทความไม่ได้มีวัตถุประสงค์เพื่อก่อให้เกิดกิจกรรมทางการเงิน, การลงทุน, การซื้อขาย, ข้อเสนอแนะ หรือคำแนะนำประเภทอื่น ๆ ที่ให้หรือรับรองโดย TradingView อ่านเพิ่มเติมใน ข้อกำหนดการใช้งาน