Ticker: XBIO
Float: ~1.25 M shares
Volume: ≈ 5.5 M shares → 4.4× float rotation
Dollar Volume: ≈ 59 M USD
Move: +266 % today
Type: Parabolic microfloat blow-off
🧩 Thesis
XBIO completed a full-float rotation and printed a parabolic move — the kind of setup that often signals retail exhaustion.
Now the chart is forming the first red daily close (FRD) after a multi-hundred-percent run, marking the shift from euphoria to distribution.
This is a textbook Steven Dux FRD short setup — high liquidity, over-rotation, and the first confirmed daily weakness.
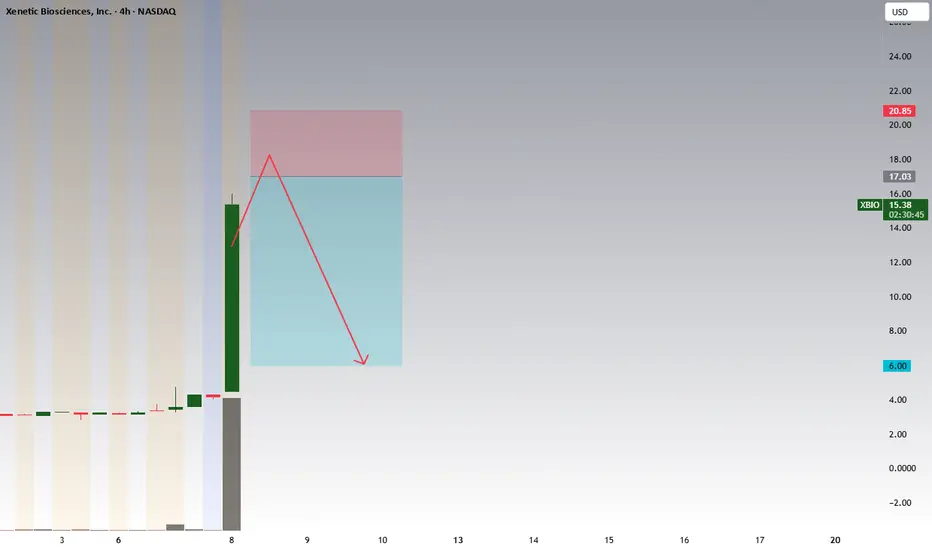
🔑 Key Levels
$20.80 – $21.00: Parabolic top / max risk zone
$17.00: Failed lower-high area / short entry trigger
$10.00: VWAP zone and mid-range target
$6.00: Pre-run base and final target
🎯 Trading Plan
FRD Short (Active Setup)
Daily candle closes red after extreme green run.
Look for an intraday lower high below $17.00 confirming backside formation.
Entry: Short on the break of $14–13.5 after the lower-high rejection.
Risk: Hard stop above $21.00 (previous day’s top).
Targets:
T1 → $11.00 (cover 30–50 %)
T2 → $8.00–$7.50
T3 → $6.00 (full fade target)
⚠️ Risk Notes
Microfloat = high halt risk. Keep sizing small and avoid chasing.
Confirmation is key: only short after the daily close is red.
If XBIO reclaims $17.50–18.00 with volume → invalidate the setup and stand aside.
🧭 Summary
XBIO rotated more than four times its float, hit +266 %, and is now printing the first red daily close — a classic blow-off exhaustion pattern.
If the weakness continues tomorrow, the FRD short toward $6–8 offers an A+ risk-reward setup.
(This plan is for educational purposes only, not financial advice.)
Float: ~1.25 M shares
Volume: ≈ 5.5 M shares → 4.4× float rotation
Dollar Volume: ≈ 59 M USD
Move: +266 % today
Type: Parabolic microfloat blow-off
🧩 Thesis
XBIO completed a full-float rotation and printed a parabolic move — the kind of setup that often signals retail exhaustion.
Now the chart is forming the first red daily close (FRD) after a multi-hundred-percent run, marking the shift from euphoria to distribution.
This is a textbook Steven Dux FRD short setup — high liquidity, over-rotation, and the first confirmed daily weakness.
🔑 Key Levels
$20.80 – $21.00: Parabolic top / max risk zone
$17.00: Failed lower-high area / short entry trigger
$10.00: VWAP zone and mid-range target
$6.00: Pre-run base and final target
🎯 Trading Plan
FRD Short (Active Setup)
Daily candle closes red after extreme green run.
Look for an intraday lower high below $17.00 confirming backside formation.
Entry: Short on the break of $14–13.5 after the lower-high rejection.
Risk: Hard stop above $21.00 (previous day’s top).
Targets:
T1 → $11.00 (cover 30–50 %)
T2 → $8.00–$7.50
T3 → $6.00 (full fade target)
⚠️ Risk Notes
Microfloat = high halt risk. Keep sizing small and avoid chasing.
Confirmation is key: only short after the daily close is red.
If XBIO reclaims $17.50–18.00 with volume → invalidate the setup and stand aside.
🧭 Summary
XBIO rotated more than four times its float, hit +266 %, and is now printing the first red daily close — a classic blow-off exhaustion pattern.
If the weakness continues tomorrow, the FRD short toward $6–8 offers an A+ risk-reward setup.
(This plan is for educational purposes only, not financial advice.)
Do not have 30K followers, do not have to share 15 trade a day, because you pay subscription, do not live from subscription, but sharing my knowledge trades and signals. For free. If you want to join, you are welcomed. t.me/+CE3Vdc5m72w4MjRk
คำจำกัดสิทธิ์ความรับผิดชอบ
ข้อมูลและบทความไม่ได้มีวัตถุประสงค์เพื่อก่อให้เกิดกิจกรรมทางการเงิน, การลงทุน, การซื้อขาย, ข้อเสนอแนะ หรือคำแนะนำประเภทอื่น ๆ ที่ให้หรือรับรองโดย TradingView อ่านเพิ่มเติมที่ ข้อกำหนดการใช้งาน