Hello traders,
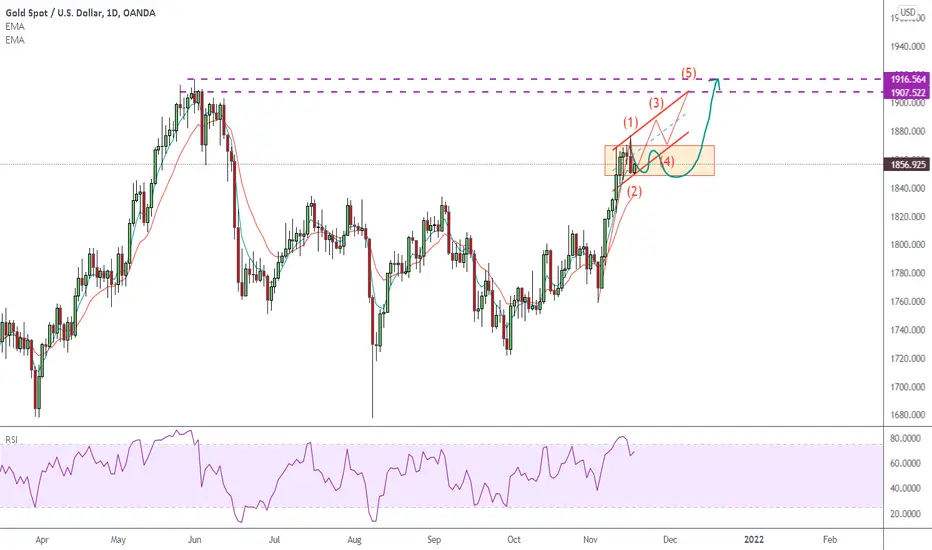
GOLD is facing two ways to reach 1900-1911 zone on daily chart.
It would go sideways inside the red rectangle to consolidate before new leg up to test new high.
Or
it would continue to rise in a rough way insidw a flat red channel till it hit the 1900-1911 zone.
Both ways would need you to setup in a lower timeframe chart .
The correction idea in my last idea is not valid anymore with new price action.
RISK LOWER THAN YOUR TOLERANCE:
Suggested Risk <5%
Your Real Entry Position Will Make Different RR for Your Trade.
GOOD LUCK!!!
LESS IS MORE!
ปิดการเทรด: ถึงเป้าหมายการตัดขาดทุน
Join Free Telegram Group to get MORE trading skills: t.me/FuntraderVera
การนำเสนอที่เกี่ยวข้อง
คำจำกัดสิทธิ์ความรับผิดชอบ
ข้อมูลและบทความไม่ได้มีวัตถุประสงค์เพื่อก่อให้เกิดกิจกรรมทางการเงิน, การลงทุน, การซื้อขาย, ข้อเสนอแนะ หรือคำแนะนำประเภทอื่น ๆ ที่ให้หรือรับรองโดย TradingView อ่านเพิ่มเติมที่ ข้อกำหนดการใช้งาน