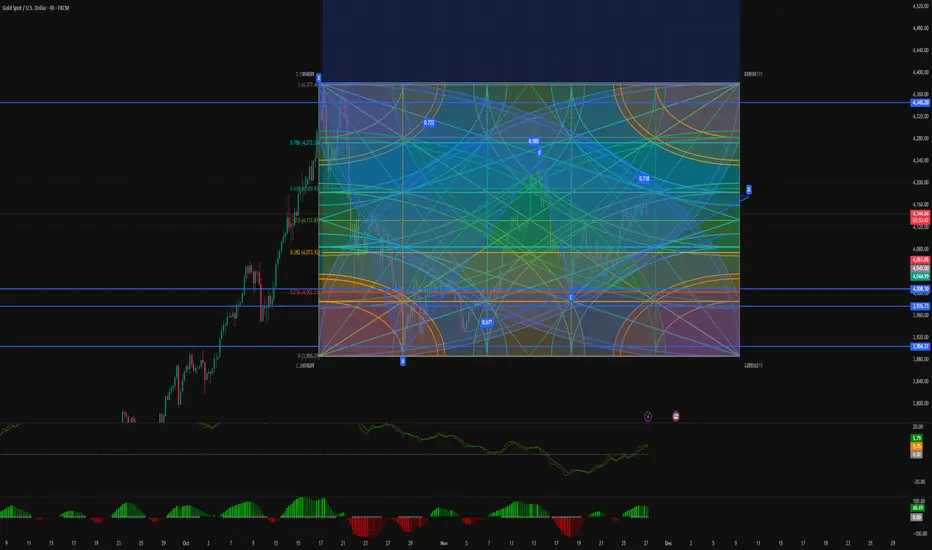
Gold is approaching one of the most important time pivot zones of the week.
Based on a combination of Gann analysis, Harmonic patterns (ABCD), Time Cycles, and momentum structure, the market is showing signs of a potential bullish reversal.
✅ Why a Bullish Move Is Likely
Several major signals are aligning:
1️⃣ Time Cycle Confluence – Strong Pivot at 9 PM UTC+2:00
Multiple time cycles, Gann angles, and the hexagonal time-star all converge around the same time window.
This type of confluence is rare — and usually marks the beginning of a new directional wave.
2️⃣ Corrective Structure Into Point D
The recent move into the D-point shows corrective behavior, not impulsive selling.
This indicates the market is preparing for a shift in direction.
3️⃣ Momentum Divergence
RSI and MACD are showing clear bullish divergence, confirming loss of bearish strength.
4️⃣ Accumulation Instead of Distribution
The last candles show:
Smaller bodies
Lower volume on the downside
Long wicks
This is typical accumulation behavior, not continuation selling.
🎯 Bullish Scenario (Primary Expectation)
If the time pivot triggers as expected, gold may start a new upward wave with potential targets:
4170
4215
4270
Extension target: 4340 if strong momentum develops.
A strong close above the micro-resistance confirms the bullish wave.
คำจำกัดสิทธิ์ความรับผิดชอบ
ข้อมูลและบทความไม่ได้มีวัตถุประสงค์เพื่อก่อให้เกิดกิจกรรมทางการเงิน, การลงทุน, การซื้อขาย, ข้อเสนอแนะ หรือคำแนะนำประเภทอื่น ๆ ที่ให้หรือรับรองโดย TradingView อ่านเพิ่มเติมใน ข้อกำหนดการใช้งาน
คำจำกัดสิทธิ์ความรับผิดชอบ
ข้อมูลและบทความไม่ได้มีวัตถุประสงค์เพื่อก่อให้เกิดกิจกรรมทางการเงิน, การลงทุน, การซื้อขาย, ข้อเสนอแนะ หรือคำแนะนำประเภทอื่น ๆ ที่ให้หรือรับรองโดย TradingView อ่านเพิ่มเติมใน ข้อกำหนดการใช้งาน