Learn the essence of Price Action Trading – a pure market analysis method based on price movement. Discover how to read candlestick patterns, identify support and resistance zones, and apply breakout, pullback, and reversal strategies to improve your trading precision and confidence.
🔍 What is Price Action?
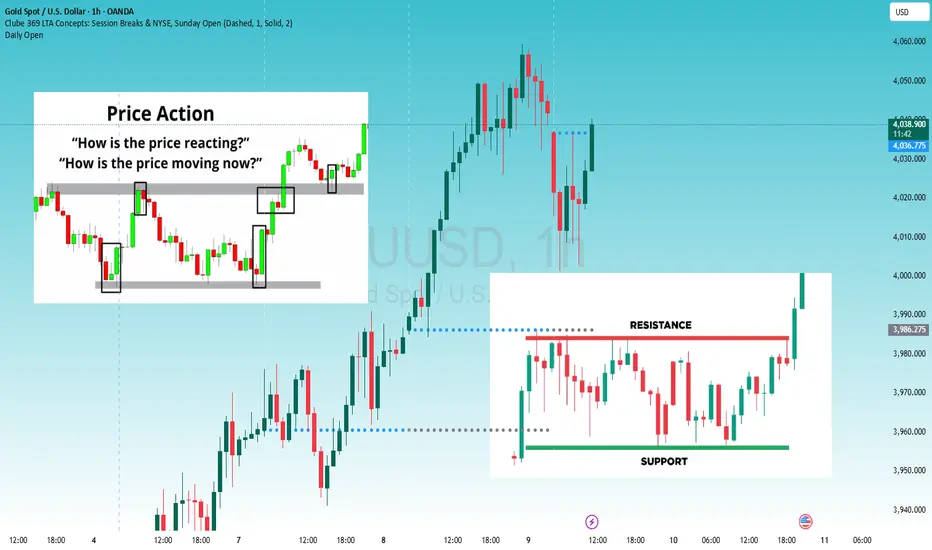
Price Action is a method of analyzing pure price movements without relying on indicators.
Traders read and interpret price behavior to understand market psychology and make informed buy/sell decisions.
Price reflects all factors from:
Buyers and sellers
Economic, political, and social influences
→ Therefore, the price chart is the most honest “language” of the market.
⚙️ Core Price Action Trading Strategies
Pullback:
Enter trades following the main trend after a temporary counter-move.
→ Example: Price breaks support, slightly pulls back, then continues downward — a Sell opportunity.
Reversal:
When price fails to break through a strong support or resistance zone, a potential reversal may form.
→ Look for confirmation through candle patterns like Doji, Engulfing, or Pin Bar.
Breakout:
When price breaks through key support or resistance, it often signals a new trend beginning.
→ Enter immediately or wait for a retest of the breakout area for safer confirmation.
📈 Steps to Trade with Price Action
Define your trading style:
Price Action works best for swing and position traders (medium to long term).
Select your trading asset:
- Works effectively with instruments influenced by supply and demand — such as stocks, forex, and commodities.
Choose your timeframes:
- H1, H4, D1, and W1 are optimal for Price Action setups.
Analyze support and resistance:
- Determine entry, stop-loss, and take-profit points based on key price zones.
Risk & money management:
- Keep each trade’s risk small (1–2% of account).
- Always set stop-loss to protect your capital.
🧩 Essential Tools in Price Action Analysis
Candlestick Charts:
- Provide insight into buyer-seller strength through candle bodies and wicks.
- Each candle tells a story about market sentiment.
Support and Resistance Zones:
- Support: A zone where price tends to bounce higher.
- Resistance: A zone where price tends to reverse downward.
Candlestick Patterns:
- Hammer: Bullish reversal signal.
- Doji: Market indecision — potential reversal point.
- Engulfing: Strong momentum shift between buyers and sellers.
Chart Patterns:
- Head & Shoulders
- Double Top / Double Bottom
→ Help anticipate the next market direction with higher accuracy.
🚀 Advanced Price Action Strategies
Breakout Trading:
- Entry: When price breaks through support or resistance.
- Stop Loss: Just beyond the broken zone.
- Take Profit: Measured by the distance between the two zones.
Retest Strategy:
- Wait for price to pull back and retest the breakout level.
- Enter if price continues in the breakout direction.
Pullback Entry:
- Enter when price touches a support/resistance level and reverses back with trend momentum.
Chart Pattern Strategy:
- Use structures like Head & Shoulders, Triangles, or Channels to identify entries with higher confidence.
⚠️ Key Notes When Trading Price Action
✅ Understand candlestick patterns and market zones deeply.
✅ Always view charts in multiple timeframes for a complete perspective.
✅ Reduce indicator clutter — price alone is enough.
✅ Practice chart reading consistently to develop intuition and confidence.
💡 Conclusion
Price Action is not just a method — it’s an art of understanding market psychology.
Once you can “read” price behavior, every entry and exit becomes clear and calculated.
🔍 What is Price Action?
Price Action is a method of analyzing pure price movements without relying on indicators.
Traders read and interpret price behavior to understand market psychology and make informed buy/sell decisions.
Price reflects all factors from:
Buyers and sellers
Economic, political, and social influences
→ Therefore, the price chart is the most honest “language” of the market.
⚙️ Core Price Action Trading Strategies
Pullback:
Enter trades following the main trend after a temporary counter-move.
→ Example: Price breaks support, slightly pulls back, then continues downward — a Sell opportunity.
Reversal:
When price fails to break through a strong support or resistance zone, a potential reversal may form.
→ Look for confirmation through candle patterns like Doji, Engulfing, or Pin Bar.
Breakout:
When price breaks through key support or resistance, it often signals a new trend beginning.
→ Enter immediately or wait for a retest of the breakout area for safer confirmation.
📈 Steps to Trade with Price Action
Define your trading style:
Price Action works best for swing and position traders (medium to long term).
Select your trading asset:
- Works effectively with instruments influenced by supply and demand — such as stocks, forex, and commodities.
Choose your timeframes:
- H1, H4, D1, and W1 are optimal for Price Action setups.
Analyze support and resistance:
- Determine entry, stop-loss, and take-profit points based on key price zones.
Risk & money management:
- Keep each trade’s risk small (1–2% of account).
- Always set stop-loss to protect your capital.
🧩 Essential Tools in Price Action Analysis
Candlestick Charts:
- Provide insight into buyer-seller strength through candle bodies and wicks.
- Each candle tells a story about market sentiment.
Support and Resistance Zones:
- Support: A zone where price tends to bounce higher.
- Resistance: A zone where price tends to reverse downward.
Candlestick Patterns:
- Hammer: Bullish reversal signal.
- Doji: Market indecision — potential reversal point.
- Engulfing: Strong momentum shift between buyers and sellers.
Chart Patterns:
- Head & Shoulders
- Double Top / Double Bottom
→ Help anticipate the next market direction with higher accuracy.
🚀 Advanced Price Action Strategies
Breakout Trading:
- Entry: When price breaks through support or resistance.
- Stop Loss: Just beyond the broken zone.
- Take Profit: Measured by the distance between the two zones.
Retest Strategy:
- Wait for price to pull back and retest the breakout level.
- Enter if price continues in the breakout direction.
Pullback Entry:
- Enter when price touches a support/resistance level and reverses back with trend momentum.
Chart Pattern Strategy:
- Use structures like Head & Shoulders, Triangles, or Channels to identify entries with higher confidence.
⚠️ Key Notes When Trading Price Action
✅ Understand candlestick patterns and market zones deeply.
✅ Always view charts in multiple timeframes for a complete perspective.
✅ Reduce indicator clutter — price alone is enough.
✅ Practice chart reading consistently to develop intuition and confidence.
💡 Conclusion
Price Action is not just a method — it’s an art of understanding market psychology.
Once you can “read” price behavior, every entry and exit becomes clear and calculated.
บันทึก
All here is basic kwowledge of Trading, just learn and enjoy itTo get FREE signal, analysis in our channel !🌟
👉 Our channel: t.me/+f1pv6ztb5zUxMTA1
👉 Our channel: t.me/+f1pv6ztb5zUxMTA1
การนำเสนอที่เกี่ยวข้อง
คำจำกัดสิทธิ์ความรับผิดชอบ
ข้อมูลและบทความไม่ได้มีวัตถุประสงค์เพื่อก่อให้เกิดกิจกรรมทางการเงิน, การลงทุน, การซื้อขาย, ข้อเสนอแนะ หรือคำแนะนำประเภทอื่น ๆ ที่ให้หรือรับรองโดย TradingView อ่านเพิ่มเติมที่ ข้อกำหนดการใช้งาน
To get FREE signal, analysis in our channel !🌟
👉 Our channel: t.me/+f1pv6ztb5zUxMTA1
👉 Our channel: t.me/+f1pv6ztb5zUxMTA1
การนำเสนอที่เกี่ยวข้อง
คำจำกัดสิทธิ์ความรับผิดชอบ
ข้อมูลและบทความไม่ได้มีวัตถุประสงค์เพื่อก่อให้เกิดกิจกรรมทางการเงิน, การลงทุน, การซื้อขาย, ข้อเสนอแนะ หรือคำแนะนำประเภทอื่น ๆ ที่ให้หรือรับรองโดย TradingView อ่านเพิ่มเติมที่ ข้อกำหนดการใช้งาน