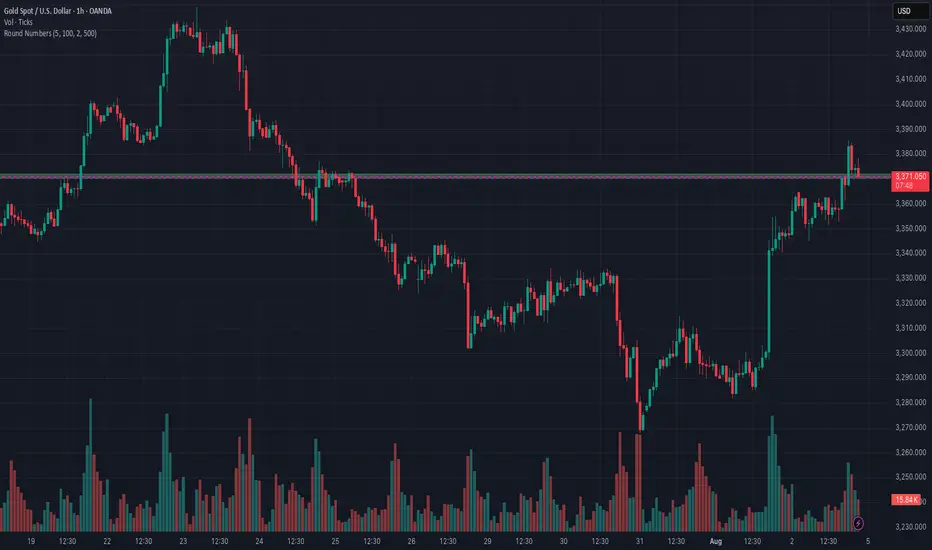
This chart highlights key price areas using two important indicators:
🔹 Volume – Helps identify high-activity zones where buyers and sellers are most engaged. Spikes in volume often signal strong interest or potential reversals.
🔹 Round Numbers – Psychological levels (e.g., 100, 500, 1000) where price tends to react due to trader bias. These act as natural support/resistance zones.
📊 Use Case:
Look for volume spikes near round numbers to find high-probability reversal or breakout setups.
Combine this with price action for better entry/exit signals.
🧠 Tip: Round number zones with strong volume support often act as key levels during trend continuation or reversal.
คำจำกัดสิทธิ์ความรับผิดชอบ
ข้อมูลและบทความไม่ได้มีวัตถุประสงค์เพื่อก่อให้เกิดกิจกรรมทางการเงิน, การลงทุน, การซื้อขาย, ข้อเสนอแนะ หรือคำแนะนำประเภทอื่น ๆ ที่ให้หรือรับรองโดย TradingView อ่านเพิ่มเติมที่ ข้อกำหนดการใช้งาน
คำจำกัดสิทธิ์ความรับผิดชอบ
ข้อมูลและบทความไม่ได้มีวัตถุประสงค์เพื่อก่อให้เกิดกิจกรรมทางการเงิน, การลงทุน, การซื้อขาย, ข้อเสนอแนะ หรือคำแนะนำประเภทอื่น ๆ ที่ให้หรือรับรองโดย TradingView อ่านเพิ่มเติมที่ ข้อกำหนดการใช้งาน