🔍 Technical Overview
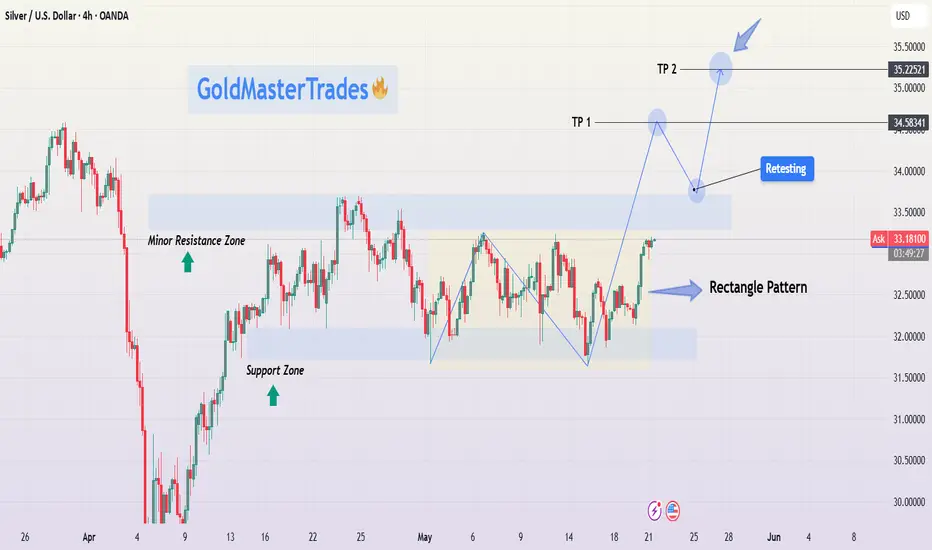
Silver has been forming a textbook rectangle consolidation pattern over the past few weeks, bouncing between a clearly defined Support Zone (~$32.10) and Resistance Zone (~$33.40). This range-bound movement indicates accumulation, a phase where smart money typically builds positions before initiating a directional breakout.
Currently, price action shows a breakout attempt toward the upper resistance. If momentum continues, we could see a bullish breakout, followed by a potential retest of the broken resistance (now support). A successful retest would confirm a high-probability setup for a move to higher targets.
📌 Key Technical Zones
Support Zone: ~$32.10
This level has been tested multiple times, with price consistently bouncing higher, signaling strong buyer interest.
Minor Resistance Zone: ~$33.00
Acted as an intermediate ceiling within the rectangle. Once broken, this level became a signpost for bullish continuation.
Main Resistance Zone: ~$33.40
The top boundary of the rectangle; this is the key breakout level.
Target 1 (TP1): $34.58
A logical resistance level based on previous price structure and breakout projection.
Target 2 (TP2): $35.22
A more extended target derived from the height of the rectangle pattern projected from the breakout point (measured move).
⚙️ Price Action Insights
Rectangle Pattern Behavior: Price ranged within horizontal support/resistance, forming consistent highs and lows — a strong signal of accumulation.
Momentum Shift: Recent bullish candles and higher lows suggest buying pressure is increasing.
Breakout in Progress: Price is currently pushing above the upper rectangle boundary. A confirmed breakout candle close followed by a retest would provide a higher-probability entry opportunity.
Retest Strategy: Retests are critical for confirmation. A pullback to ~$33.40 with rejection signals (e.g., bullish engulfing, pin bar) would strengthen the case for further upside.
🧠 Mindset & Strategy Explanation
This setup represents patience, structure, and discipline in trading:
✅ Wait for the Pattern: Rectangle patterns often trap impatient traders. Waiting for a confirmed breakout and retest gives higher-quality entries.
✅ Risk Management is Key: Use the structure of the rectangle to define risk. Stops should be set just below the last swing low or inside the range.
✅ Targeting with Precision: TP1 and TP2 are not random — they’re derived from prior resistance levels and pattern projections. This keeps your trading logical, not emotional.
✅ Mind Over Market: Don’t chase breakouts. Wait for confirmation. The retest is often your friend in swing trading setups like this.
📋 Trade Idea (Not Financial Advice)
📍 Entry: On confirmed breakout above $33.40 or retest of this level with bullish confirmation.
🎯 Target 1: $34.58 (partial take profit suggested)
🎯 Target 2: $35.22 (measured move projection)
🛑 Stop Loss: Below $32.70 (under recent support structure)
🔁 Optional: Trail stop loss after TP1 to lock in profits as TP2 approaches.
🧠 Final Thoughts for Traders
This chart provides a clean example of how price consolidates before expansion. The rectangle pattern allows for easy identification of entry/exit zones and offers a solid risk-to-reward setup. Whether you're a new trader learning to spot consolidation patterns or a seasoned pro looking for low-risk, high-reward setups — this XAGUSD formation is one to watch.
Keep an eye on volume and candle structure around the breakout zone. Confirmation is key. Discipline is everything.
การนำเสนอที่เกี่ยวข้อง
คำจำกัดสิทธิ์ความรับผิดชอบ
ข้อมูลและบทความไม่ได้มีวัตถุประสงค์เพื่อก่อให้เกิดกิจกรรมทางการเงิน, การลงทุน, การซื้อขาย, ข้อเสนอแนะ หรือคำแนะนำประเภทอื่น ๆ ที่ให้หรือรับรองโดย TradingView อ่านเพิ่มเติมที่ ข้อกำหนดการใช้งาน
การนำเสนอที่เกี่ยวข้อง
คำจำกัดสิทธิ์ความรับผิดชอบ
ข้อมูลและบทความไม่ได้มีวัตถุประสงค์เพื่อก่อให้เกิดกิจกรรมทางการเงิน, การลงทุน, การซื้อขาย, ข้อเสนอแนะ หรือคำแนะนำประเภทอื่น ๆ ที่ให้หรือรับรองโดย TradingView อ่านเพิ่มเติมที่ ข้อกำหนดการใช้งาน