WTI Crude Oil Daily Chart Analysis
**Trend & Structure:**
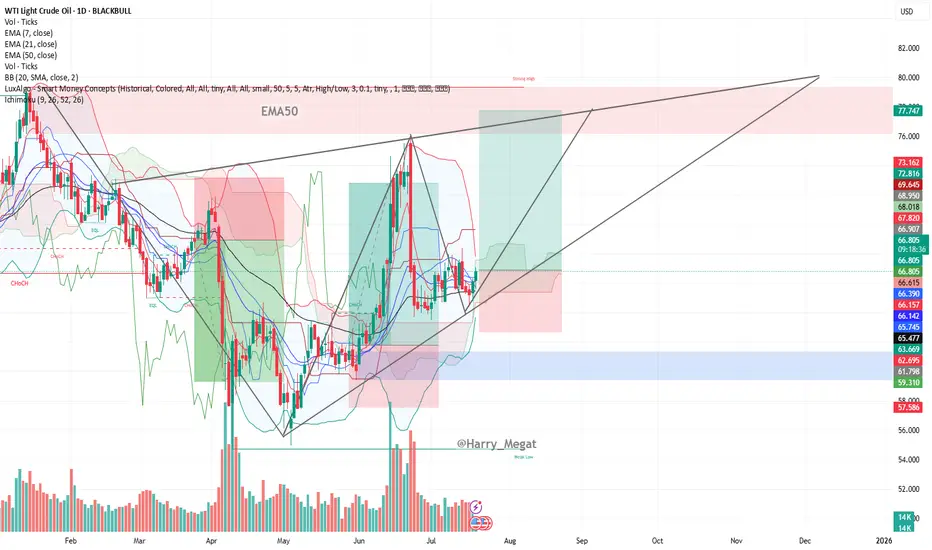
* The chart displays a **symmetrical triangle** formation, signaling a **potential breakout setup**.
* Price is currently trading around **\$66.78**, gradually rising from its recent consolidation.
* **Higher lows** and **lower highs** indicate a tightening range, which usually precedes a sharp move.
**Support & Resistance:**
* **Support Zone:** Around **\$65.47–\$66.15**, marked by the 50 EMA and prior price reactions.
* **Resistance Levels:**
* **\$68.95** – Short-term resistance and previous peak.
* **\$72.81** – Strong horizontal resistance.
* **\$77.75–\$80.00** – Projected upper trendline zone of triangle.
**Moving Averages (Bullish Setup):**
* EMA 7: **\$66.15**
* EMA 21: **\$66.14**
* EMA 50: **\$65.47**
* All EMAs are aligned in bullish order (7 > 21 > 50), confirming **bullish momentum**.
**Volume Insight:**
* Volume remains relatively steady; a spike in volume with breakout from the triangle would confirm trend continuation.
**Trade Setup Suggestion (based on chart):**
* **Breakout Buy Idea:** If price breaks above **\$68.95–\$70**, potential upside to **\$77–\$80**.
* **Invalidation:** A break below **\$65** would invalidate the bullish structure.
**Conclusion:**
WTI crude oil is trading within a symmetrical triangle, supported by bullish EMAs and tightening price action. A breakout above \$69 could trigger a bullish rally toward \$77–\$80. Keep an eye on volume confirmation and geopolitical headlines that can impact oil fundamentals.

**Trend & Structure:**
* The chart displays a **symmetrical triangle** formation, signaling a **potential breakout setup**.
* Price is currently trading around **\$66.78**, gradually rising from its recent consolidation.
* **Higher lows** and **lower highs** indicate a tightening range, which usually precedes a sharp move.
**Support & Resistance:**
* **Support Zone:** Around **\$65.47–\$66.15**, marked by the 50 EMA and prior price reactions.
* **Resistance Levels:**
* **\$68.95** – Short-term resistance and previous peak.
* **\$72.81** – Strong horizontal resistance.
* **\$77.75–\$80.00** – Projected upper trendline zone of triangle.
**Moving Averages (Bullish Setup):**
* EMA 7: **\$66.15**
* EMA 21: **\$66.14**
* EMA 50: **\$65.47**
* All EMAs are aligned in bullish order (7 > 21 > 50), confirming **bullish momentum**.
**Volume Insight:**
* Volume remains relatively steady; a spike in volume with breakout from the triangle would confirm trend continuation.
**Trade Setup Suggestion (based on chart):**
* **Breakout Buy Idea:** If price breaks above **\$68.95–\$70**, potential upside to **\$77–\$80**.
* **Invalidation:** A break below **\$65** would invalidate the bullish structure.
**Conclusion:**
WTI crude oil is trading within a symmetrical triangle, supported by bullish EMAs and tightening price action. A breakout above \$69 could trigger a bullish rally toward \$77–\$80. Keep an eye on volume confirmation and geopolitical headlines that can impact oil fundamentals.
การซื้อขายยังคงดำเนินอยู่
WTI Breakout Update* **Breakout Confirmed:** Price has successfully **broken above \$68.95–\$70 range**, reaching **\$69.30+**.
* **Trend:** Bullish breakout from **symmetrical triangle** now in play.
* **Next Targets:**
* 🎯 **\$72.80** (horizontal resistance)
* 🎯 **\$77.75–\$80.00** (upper triangle trendline zone)
Watch Now:
* **Volume:** Watch for rising volume to confirm momentum.
* **Pullback Zone:** Retest near **\$68.95–\$69.00** could offer fresh entries.
* **Risk Management:** Move stop-loss to **breakeven or just below \$68.50** to lock in gains.
คำจำกัดสิทธิ์ความรับผิดชอบ
ข้อมูลและบทความไม่ได้มีวัตถุประสงค์เพื่อก่อให้เกิดกิจกรรมทางการเงิน, การลงทุน, การซื้อขาย, ข้อเสนอแนะ หรือคำแนะนำประเภทอื่น ๆ ที่ให้หรือรับรองโดย TradingView อ่านเพิ่มเติมที่ ข้อกำหนดการใช้งาน
คำจำกัดสิทธิ์ความรับผิดชอบ
ข้อมูลและบทความไม่ได้มีวัตถุประสงค์เพื่อก่อให้เกิดกิจกรรมทางการเงิน, การลงทุน, การซื้อขาย, ข้อเสนอแนะ หรือคำแนะนำประเภทอื่น ๆ ที่ให้หรือรับรองโดย TradingView อ่านเพิ่มเติมที่ ข้อกำหนดการใช้งาน