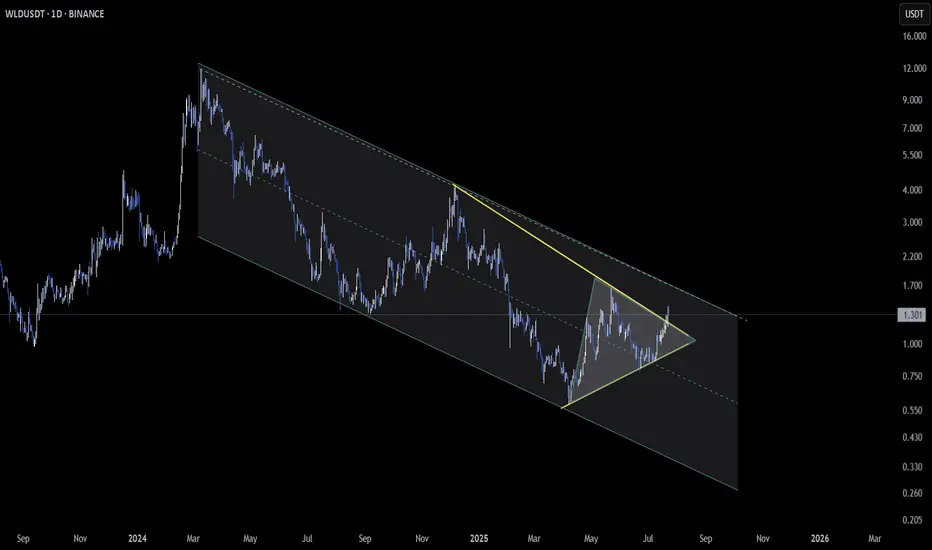
🔹 4H Chart: A clear breakout from a symmetrical triangle, signaling potential bullish momentum. If this breakout sustains with volume, short-term upside may follow.
🔸 Daily Chart: Price is still confined within a descending channel. This structure has been respected, and unless it’s broken, the broader trend remains capped.
👀 A potential scenario:
If the 4H breakout holds and the daily descending channel breaks, it could trigger a strong leg upward.
But if price gets rejected at the upper boundary of the daily channel, we may see a fade back into consolidation.
📌 Watch for volume confirmation and reaction near the daily resistance zone. A multi-timeframe breakout could bring explosive momentum.
Stay sharp and manage risk accordingly.
I share more in my court
Join me on X: x.com/Coin_Mastermind
Join me on Telegram: t.me/coin_mastermind
Join me on X: x.com/Coin_Mastermind
Join me on Telegram: t.me/coin_mastermind
คำจำกัดสิทธิ์ความรับผิดชอบ
ข้อมูลและบทความไม่ได้มีวัตถุประสงค์เพื่อก่อให้เกิดกิจกรรมทางการเงิน, การลงทุน, การซื้อขาย, ข้อเสนอแนะ หรือคำแนะนำประเภทอื่น ๆ ที่ให้หรือรับรองโดย TradingView อ่านเพิ่มเติมที่ ข้อกำหนดการใช้งาน