[h3]Vinati Organics Ltd – Weekly Chart Analysis[/h3]
1. Current Correction and Support Zone
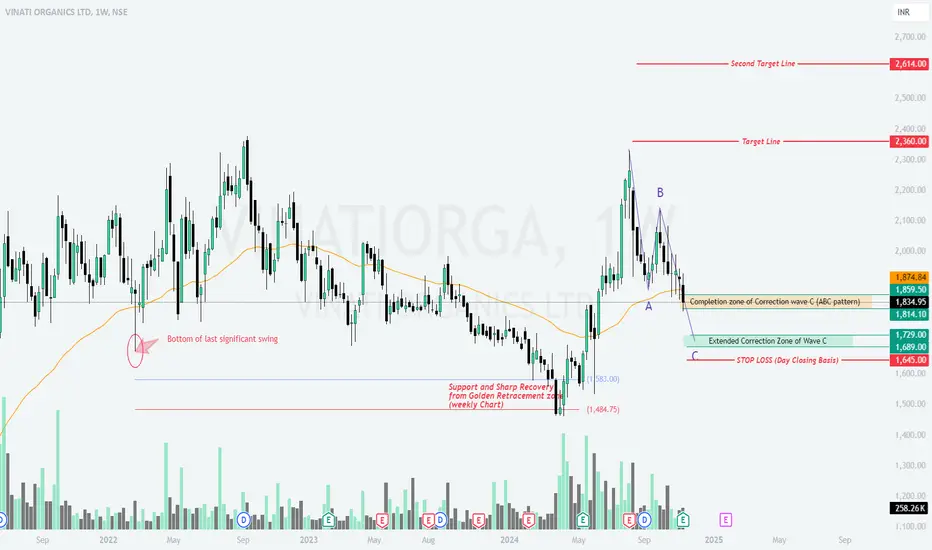
The price has completed the ABC corrective structure with wave C nearing its completion in the Extended Correction Zone (₹1,729-₹1,689).
The current price (₹1,834.95) is hovering near the completion zone of wave C, and a sharp recovery is anticipated if support holds.
2. Key Levels and Trading Plan
b Bullish Scenario
Sustained buying from the current levels or the demand zone (₹1,729-₹1,689) could lead to a recovery toward the following target zones:
Target 1: ₹2,360
Target 2: ₹2,614
b Bearish Scenario
A break below ₹1,645 (on a day closing basis) could invalidate the bullish setup, with potential downside to lower levels.
3. Observations and Indicators
Support at Golden Retracement Zone: The stock had shown sharp recoveries in the past from the 61.8% Fibonacci retracement levels, as seen in earlier price movements on the weekly timeframe.
Volume Analysis: A noticeable increase in volume during previous support testing phases indicates buyer interest around key levels.
4. Key Risks
A failure to hold the current correction zone could push the stock toward lower levels. Watch for macroeconomic factors or company-specific news that might impact sentiment.
[h3]📈 What’s Your Take on the Setup?[/h3]
Are we heading toward the targets, or will bears take over? Share your insights in the comments! 🚀📉
1. Current Correction and Support Zone
The price has completed the ABC corrective structure with wave C nearing its completion in the Extended Correction Zone (₹1,729-₹1,689).
The current price (₹1,834.95) is hovering near the completion zone of wave C, and a sharp recovery is anticipated if support holds.
2. Key Levels and Trading Plan
b Bullish Scenario
Sustained buying from the current levels or the demand zone (₹1,729-₹1,689) could lead to a recovery toward the following target zones:
Target 1: ₹2,360
Target 2: ₹2,614
b Bearish Scenario
A break below ₹1,645 (on a day closing basis) could invalidate the bullish setup, with potential downside to lower levels.
3. Observations and Indicators
Support at Golden Retracement Zone: The stock had shown sharp recoveries in the past from the 61.8% Fibonacci retracement levels, as seen in earlier price movements on the weekly timeframe.
Volume Analysis: A noticeable increase in volume during previous support testing phases indicates buyer interest around key levels.
4. Key Risks
A failure to hold the current correction zone could push the stock toward lower levels. Watch for macroeconomic factors or company-specific news that might impact sentiment.
[h3]📈 What’s Your Take on the Setup?[/h3]
Are we heading toward the targets, or will bears take over? Share your insights in the comments! 🚀📉
คำจำกัดสิทธิ์ความรับผิดชอบ
ข้อมูลและบทความไม่ได้มีวัตถุประสงค์เพื่อก่อให้เกิดกิจกรรมทางการเงิน, การลงทุน, การซื้อขาย, ข้อเสนอแนะ หรือคำแนะนำประเภทอื่น ๆ ที่ให้หรือรับรองโดย TradingView อ่านเพิ่มเติมที่ ข้อกำหนดการใช้งาน
คำจำกัดสิทธิ์ความรับผิดชอบ
ข้อมูลและบทความไม่ได้มีวัตถุประสงค์เพื่อก่อให้เกิดกิจกรรมทางการเงิน, การลงทุน, การซื้อขาย, ข้อเสนอแนะ หรือคำแนะนำประเภทอื่น ๆ ที่ให้หรือรับรองโดย TradingView อ่านเพิ่มเติมที่ ข้อกำหนดการใช้งาน