In - depth: USOIL 1 - hr Chart - Significance of 60.00 Support
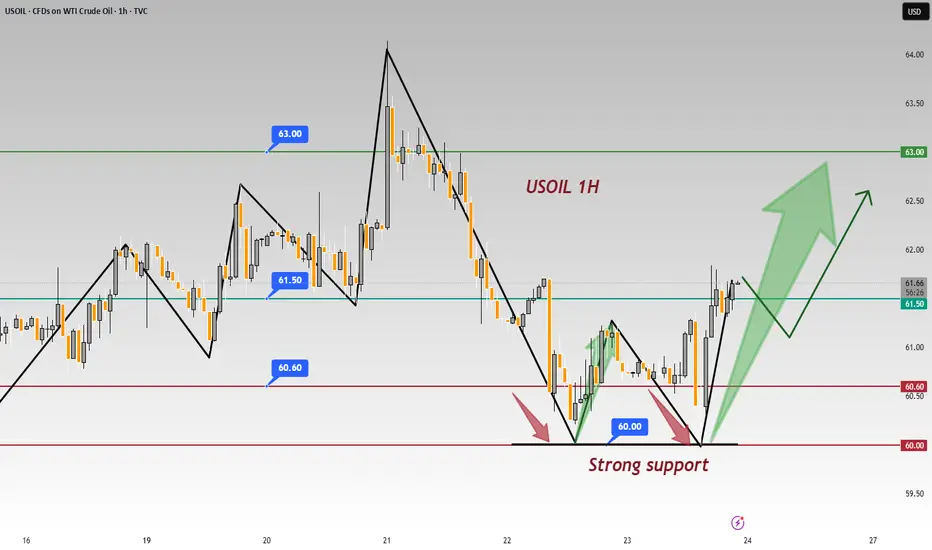
In the USOIL 1 - hour chart, 60.00 acts as a strong support 💪.
Support Validation
The price twice failed to break 60.00 and rebounded 📈. Psychologically, investors see 60.00 as a key level 🔑. Approaching it, buy orders pour in as they think crude oil is undervalued 📉. Technically, it's on a support line from prior lows, and repeated tests have fortified its support 🛡️.
⚡️⚡️⚡️ USOil ⚡️⚡️⚡️
🚀 Buy@ 60.00 - 60.60
🚀 TP 62.50 - 62.80
Accurate signals are updated every day 📈 If you encounter any problems during trading, these signals can serve as your reliable guide 🧭 Feel free to refer to them! I sincerely hope they'll be of great help to you 🌟 👇
การซื้อขายยังคงดำเนินอยู่
The price twice failed to break 60.00 and rebounded,Psychologically, investors see 60.00 as a key level,Let's look forward to Monday!การนำเสนอที่เกี่ยวข้อง
คำจำกัดสิทธิ์ความรับผิดชอบ
ข้อมูลและบทความไม่ได้มีวัตถุประสงค์เพื่อก่อให้เกิดกิจกรรมทางการเงิน, การลงทุน, การซื้อขาย, ข้อเสนอแนะ หรือคำแนะนำประเภทอื่น ๆ ที่ให้หรือรับรองโดย TradingView อ่านเพิ่มเติมที่ ข้อกำหนดการใช้งาน
การนำเสนอที่เกี่ยวข้อง
คำจำกัดสิทธิ์ความรับผิดชอบ
ข้อมูลและบทความไม่ได้มีวัตถุประสงค์เพื่อก่อให้เกิดกิจกรรมทางการเงิน, การลงทุน, การซื้อขาย, ข้อเสนอแนะ หรือคำแนะนำประเภทอื่น ๆ ที่ให้หรือรับรองโดย TradingView อ่านเพิ่มเติมที่ ข้อกำหนดการใช้งาน