#USDT.D
(4H Chart)
🔹️ USDT Dominance Analysis 🔹️
USDT dominance usually moves in the opposite direction of Bitcoin — when Bitcoin rises, this index tends to fall, and vice versa.
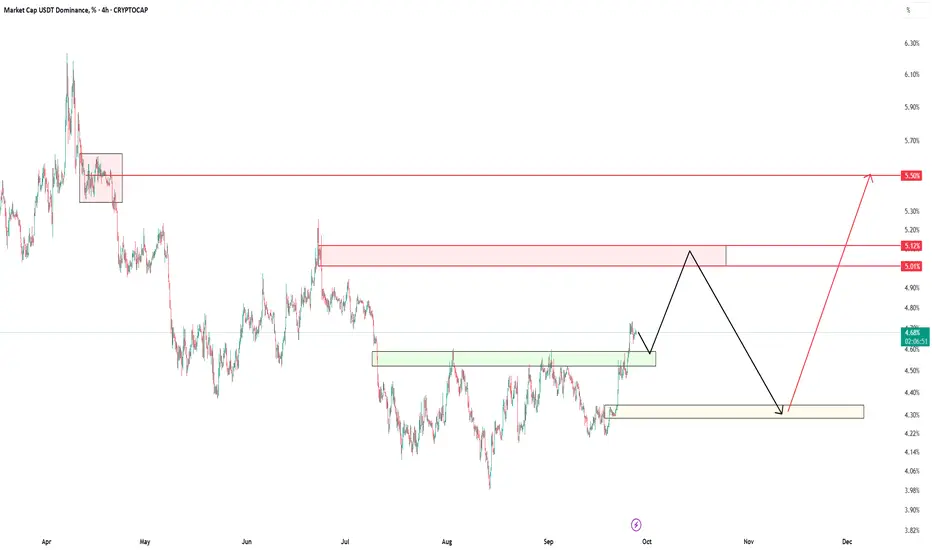
🟢 Green Box (Current Support)
The current support level for USDT dominance is in the green box: 4.60 – 4.50%.
We expect the price to move toward this level first, and after touching it, head toward the red box.
🟥 Red Box (Main Resistance)
The red box is at 5.00 – 5.12%.
This is the first and most important resistance level ahead.
After reaching this level, a correction is expected back toward the yellow box.
🟡 Yellow Box (Key Support)
The yellow box sits at 4.30%, which is a strong support area.
Once this level is tested, a major bullish move in USDT dominance is expected, targeting around 5.50%.
🎯 Final Target
When USDT dominance reaches 5.50%, the crypto market will likely be near its price bottoms.
💡 These bottoms could approximately align with Bitcoin around $85,000 and Ethereum around $3,000.
🆔 Rasoolahmadi
(4H Chart)
🔹️ USDT Dominance Analysis 🔹️
USDT dominance usually moves in the opposite direction of Bitcoin — when Bitcoin rises, this index tends to fall, and vice versa.
🟢 Green Box (Current Support)
The current support level for USDT dominance is in the green box: 4.60 – 4.50%.
We expect the price to move toward this level first, and after touching it, head toward the red box.
🟥 Red Box (Main Resistance)
The red box is at 5.00 – 5.12%.
This is the first and most important resistance level ahead.
After reaching this level, a correction is expected back toward the yellow box.
🟡 Yellow Box (Key Support)
The yellow box sits at 4.30%, which is a strong support area.
Once this level is tested, a major bullish move in USDT dominance is expected, targeting around 5.50%.
🎯 Final Target
When USDT dominance reaches 5.50%, the crypto market will likely be near its price bottoms.
💡 These bottoms could approximately align with Bitcoin around $85,000 and Ethereum around $3,000.
🆔 Rasoolahmadi
คำจำกัดสิทธิ์ความรับผิดชอบ
ข้อมูลและบทความไม่ได้มีวัตถุประสงค์เพื่อก่อให้เกิดกิจกรรมทางการเงิน, การลงทุน, การซื้อขาย, ข้อเสนอแนะ หรือคำแนะนำประเภทอื่น ๆ ที่ให้หรือรับรองโดย TradingView อ่านเพิ่มเติมที่ ข้อกำหนดการใช้งาน
คำจำกัดสิทธิ์ความรับผิดชอบ
ข้อมูลและบทความไม่ได้มีวัตถุประสงค์เพื่อก่อให้เกิดกิจกรรมทางการเงิน, การลงทุน, การซื้อขาย, ข้อเสนอแนะ หรือคำแนะนำประเภทอื่น ๆ ที่ให้หรือรับรองโดย TradingView อ่านเพิ่มเติมที่ ข้อกำหนดการใช้งาน