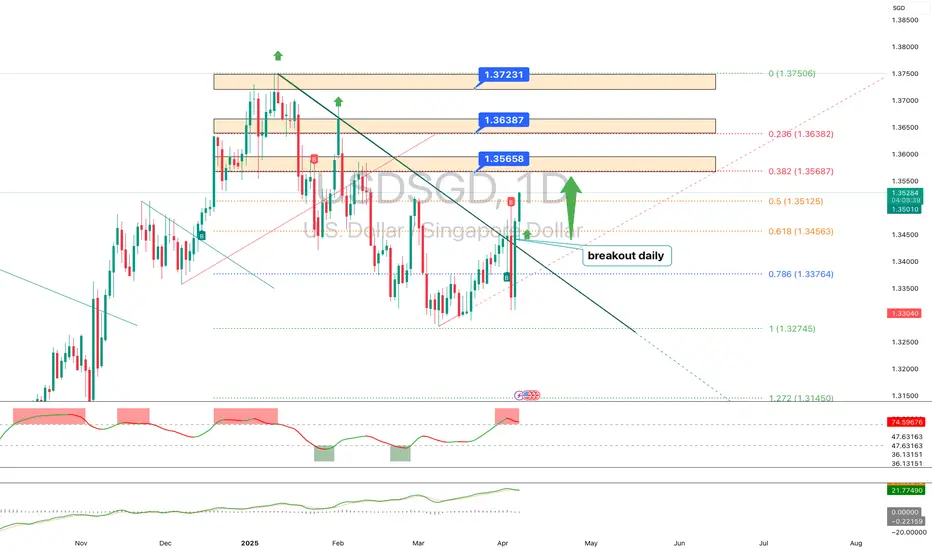
USDSGD has broken out of a descending trendline on the daily timeframe – signaling a potential shift in short-term momentum. Price has held above 1.3510, confirming the breakout and opening the door to resistance zones at 1.3565–1.3638 (aligned with 0.382 and 0.236 Fibonacci levels).
If bulls stay in control, next targets lie at 1.3723 and 1.3750. However, a short pullback toward the 1.3450–1.3480 support zone (0.618 Fibo) is also possible.
🔹 Main scenario: continuation to 1.3565 → 1.3638 → 1.3723.
🔹 Alternative scenario: drop below 1.3450 toward 1.3376 or 1.3274.
If bulls stay in control, next targets lie at 1.3723 and 1.3750. However, a short pullback toward the 1.3450–1.3480 support zone (0.618 Fibo) is also possible.
🔹 Main scenario: continuation to 1.3565 → 1.3638 → 1.3723.
🔹 Alternative scenario: drop below 1.3450 toward 1.3376 or 1.3274.
👨🎓 Наш телеграм t.me/totoshkatrading
🉐 Платформы linktr.ee/totoshka55
💬 Наши контакты @Totoshkatips
🔗 Сайт totoshkatrades.com
🉐 Платформы linktr.ee/totoshka55
💬 Наши контакты @Totoshkatips
🔗 Сайт totoshkatrades.com
คำจำกัดสิทธิ์ความรับผิดชอบ
ข้อมูลและบทความไม่ได้มีวัตถุประสงค์เพื่อก่อให้เกิดกิจกรรมทางการเงิน, การลงทุน, การซื้อขาย, ข้อเสนอแนะ หรือคำแนะนำประเภทอื่น ๆ ที่ให้หรือรับรองโดย TradingView อ่านเพิ่มเติมที่ ข้อกำหนดการใช้งาน