1. Overall Trend
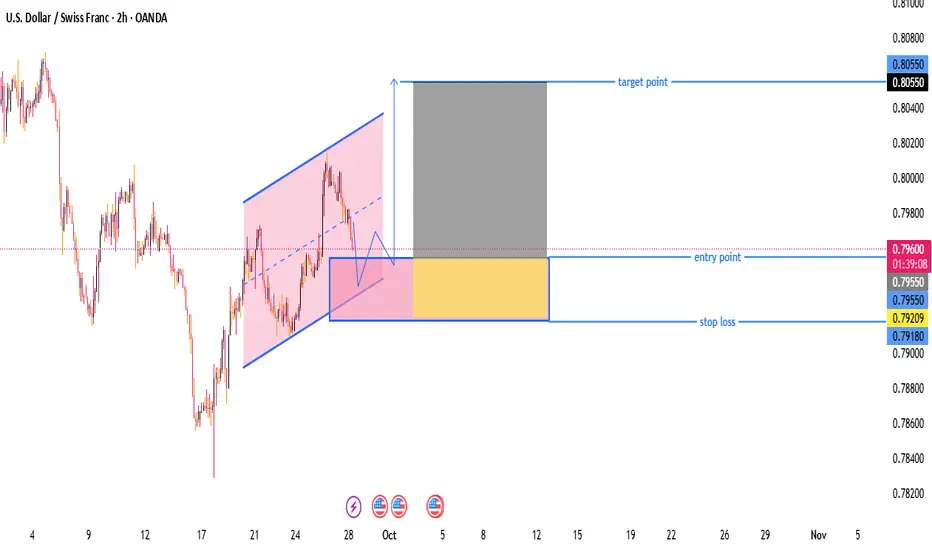
Price had been in a downtrend but recently reversed into a rising channel (highlighted in pink).
The price broke below the lower trendline of the channel, indicating a potential pullback or temporary correction.
2. Chart Pattern & Idea
After breaking the ascending channel, the chart suggests a potential bullish continuation (a breakout-retest strategy).
The drawn pattern shows a pullback to a support zone (highlighted in blue box) where price may bounce.
🟦 Trade Setup
Component Value Comment
Entry Point 0.79596 Current price, just above support zone
Stop Loss 0.79180 Below key support area
Target Point 0.80550 At prior resistance / measured move
✅ Risk/Reward Ratio
Risk: ~41 pips (0.79596 - 0.79180)
Reward: ~95 pips (0.80550 - 0.79596)
R:R Ratio: ~2.3:1 — favorable
📌 Key Technical Observations
Support Zone (Buy Area)
Between 0.79209 and 0.79550, this is a demand zone where price is expected to bounce.
Marked by a consolidation area and minor structure support.
Target Area
0.80550 aligns with a previous high and resistance level.
Also matches a measured move of the previous channel height.
Bullish Confirmation
Price might need to form a higher low or bullish candlestick pattern inside the support zone to validate entry.
⚠️ Potential Risks
If price breaks and closes below 0.79180, it invalidates the bullish thesis.
Market may retest lower support levels or re-enter the downtrend.
USD/CHF is also impacted by USD strength/weakness and Swiss Franc safe-haven flows (watch news).
📈 Summary: Trade Plan
Bias: Bullish
Entry: Buy around 0.79596 (or on bullish confirmation within support zone)
Stop Loss: 0.79180
Take Profit: 0.80550
Risk-Reward: Good (2.3:1)
join my telegram channel t.me/goldmitalteamhttps://t.me/goldmitalteam
คำจำกัดสิทธิ์ความรับผิดชอบ
ข้อมูลและบทความไม่ได้มีวัตถุประสงค์เพื่อก่อให้เกิดกิจกรรมทางการเงิน, การลงทุน, การซื้อขาย, ข้อเสนอแนะ หรือคำแนะนำประเภทอื่น ๆ ที่ให้หรือรับรองโดย TradingView อ่านเพิ่มเติมที่ ข้อกำหนดการใช้งาน
join my telegram channel t.me/goldmitalteamhttps://t.me/goldmitalteam
คำจำกัดสิทธิ์ความรับผิดชอบ
ข้อมูลและบทความไม่ได้มีวัตถุประสงค์เพื่อก่อให้เกิดกิจกรรมทางการเงิน, การลงทุน, การซื้อขาย, ข้อเสนอแนะ หรือคำแนะนำประเภทอื่น ๆ ที่ให้หรือรับรองโดย TradingView อ่านเพิ่มเติมที่ ข้อกำหนดการใช้งาน