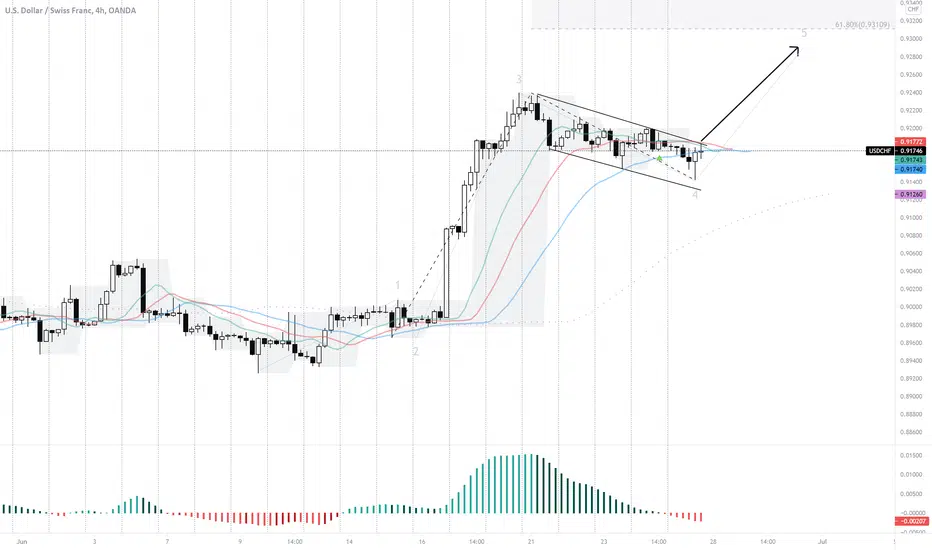
I have marked the chart with potential Elliott wave on the 4 hour chart.
We see a strong wave 3 up followed by what can be seen as a bullish flag on the D1 chart and some sort of a bear wedge on the 4 hour chart
From what I Call THE SETUP ONE concept it is a wave 4 within tight boxes. I see a 4 hour bullish candle. I am long above this
Long Entry: 0.9175
Stop Loss: 0.9135
Target 1: (Peak of Wave 3) @ 0.9233
Target 2 : This is the Target Zone 1 are 0.9295
Good luck!
To get our premium tools visit: itradeaims.net
คำจำกัดสิทธิ์ความรับผิดชอบ
ข้อมูลและบทความไม่ได้มีวัตถุประสงค์เพื่อก่อให้เกิดกิจกรรมทางการเงิน, การลงทุน, การซื้อขาย, ข้อเสนอแนะ หรือคำแนะนำประเภทอื่น ๆ ที่ให้หรือรับรองโดย TradingView อ่านเพิ่มเติมที่ ข้อกำหนดการใช้งาน
To get our premium tools visit: itradeaims.net
คำจำกัดสิทธิ์ความรับผิดชอบ
ข้อมูลและบทความไม่ได้มีวัตถุประสงค์เพื่อก่อให้เกิดกิจกรรมทางการเงิน, การลงทุน, การซื้อขาย, ข้อเสนอแนะ หรือคำแนะนำประเภทอื่น ๆ ที่ให้หรือรับรองโดย TradingView อ่านเพิ่มเติมที่ ข้อกำหนดการใช้งาน