US30 Approaching Key Support Zone – Potential Reversal Ahead?
📊 Chart Overview:
Timeframe: Looks like an intraday (maybe 1H or 2H).
Indicators:
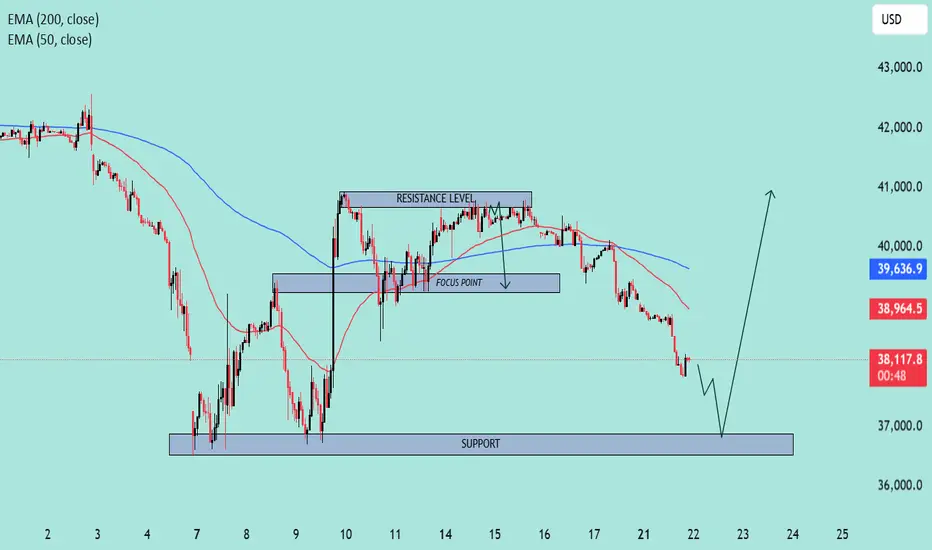
EMA 50 (Red): 38,964.7
EMA 200 (Blue): 39,637.0
🔍 Key Levels & Structure:
🔵 Support Zone (Highlighted):
Around 36,800 – 37,200 range.
This is a well-tested support level where price previously bounced.
Current price action is approaching this zone again, which increases the chance of a potential bullish reaction.
🟣 Resistance Level:
Defined around 40,500 area.
Price has rejected multiple times from this zone.
Previously served as a consolidation/decision area.
📍 Focus Point (Previous Support Turned Resistance):
Near 38,700 – 39,000.
This level may act as a reaction point on the way back up.
📉 Current Price Action:
Strong downward momentum heading into the support zone.
Price is under both EMAs, suggesting short-term bearish trend.
However, the drawn arrow suggests a potential reversal bounce from the support.
🧠 Interpretation & Scenario Plan:
🅰️ Bullish Scenario:
Price touches or sweeps the support zone.
Bullish structure or reversal candle forms (e.g., hammer, bullish engulfing).
Break back above EMA 50 & Focus Point could confirm the shift.
Target: Revisit Resistance Zone (above 40,000).
🅱️ Bearish Scenario:
Support fails to hold.
Clean break below 36,800 with volume could lead to accelerated sell-off.
Watch for breakdown retests of support turned resistance.
🔔 Takeaway:
⚠️ Current move is bearish, but price is approaching a key demand zone. Bulls might step in if the zone holds. Confirmation is key before going long. Reclaiming EMAs would strengthen bullish bias.
Timeframe: Looks like an intraday (maybe 1H or 2H).
Indicators:
EMA 50 (Red): 38,964.7
EMA 200 (Blue): 39,637.0
🔍 Key Levels & Structure:
🔵 Support Zone (Highlighted):
Around 36,800 – 37,200 range.
This is a well-tested support level where price previously bounced.
Current price action is approaching this zone again, which increases the chance of a potential bullish reaction.
🟣 Resistance Level:
Defined around 40,500 area.
Price has rejected multiple times from this zone.
Previously served as a consolidation/decision area.
📍 Focus Point (Previous Support Turned Resistance):
Near 38,700 – 39,000.
This level may act as a reaction point on the way back up.
📉 Current Price Action:
Strong downward momentum heading into the support zone.
Price is under both EMAs, suggesting short-term bearish trend.
However, the drawn arrow suggests a potential reversal bounce from the support.
🧠 Interpretation & Scenario Plan:
🅰️ Bullish Scenario:
Price touches or sweeps the support zone.
Bullish structure or reversal candle forms (e.g., hammer, bullish engulfing).
Break back above EMA 50 & Focus Point could confirm the shift.
Target: Revisit Resistance Zone (above 40,000).
🅱️ Bearish Scenario:
Support fails to hold.
Clean break below 36,800 with volume could lead to accelerated sell-off.
Watch for breakdown retests of support turned resistance.
🔔 Takeaway:
⚠️ Current move is bearish, but price is approaching a key demand zone. Bulls might step in if the zone holds. Confirmation is key before going long. Reclaiming EMAs would strengthen bullish bias.
การซื้อขายยังคงดำเนินอยู่
ปิดการเทรด: ถึงเป้าหมายการทำกำไร
Important:
It's important to understand that the arrow projection on a market analysis doesn't necessarily mean that the market will reach the exact endpoint of the arrow or even the entire length of it. Instead, the arrow is meant to provide guidance on potential market bias.
When your analysis starts to move in a profitable direction, it's a good idea to adjust your stop loss to the entry point and consider taking partial profits.
This can help to protect your gains and manage your risk appropriately!
JOIN MY TELEGRAM CHANNEL
t.me/StellarMarketAnalysis
JOIN MY RECOMMENTED BROKER REFFREL LINK
⤵️one.exnesstrack.net/a/uvd1etcgg1
PARTNER CODE⤵️
uvd1etcgg1
t.me/StellarMarketAnalysis
JOIN MY RECOMMENTED BROKER REFFREL LINK
⤵️one.exnesstrack.net/a/uvd1etcgg1
PARTNER CODE⤵️
uvd1etcgg1
การนำเสนอที่เกี่ยวข้อง
คำจำกัดสิทธิ์ความรับผิดชอบ
ข้อมูลและบทความไม่ได้มีวัตถุประสงค์เพื่อก่อให้เกิดกิจกรรมทางการเงิน, การลงทุน, การซื้อขาย, ข้อเสนอแนะ หรือคำแนะนำประเภทอื่น ๆ ที่ให้หรือรับรองโดย TradingView อ่านเพิ่มเติมที่ ข้อกำหนดการใช้งาน