📈 DJI30 / US30 – Dow Jones Industrial Average Trade Opportunity Guide
🏛️ Market Context
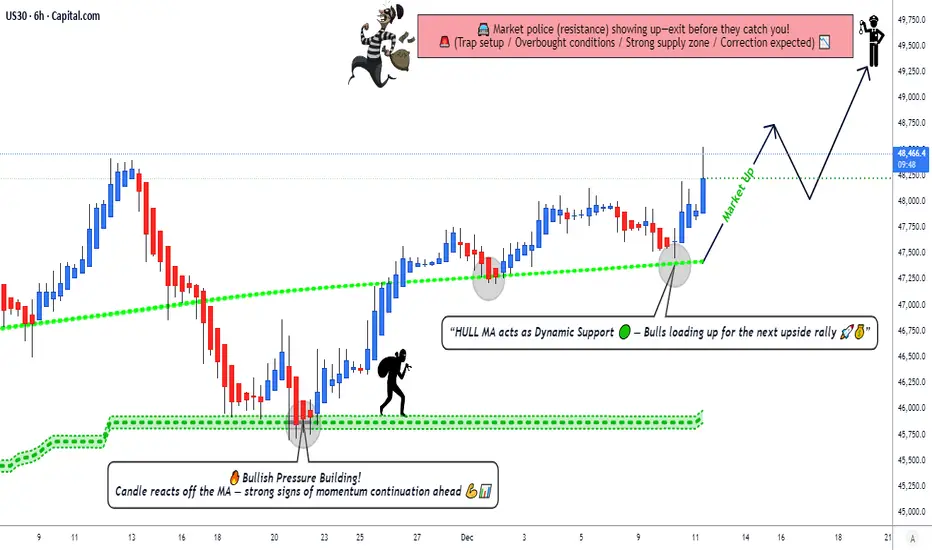
The index is showing strong accumulation pressure, with buyers stepping back in as volatility narrows. Momentum tools and trend metrics continue to lean toward the upside, creating a setup where disciplined layering becomes highly effective for precision entries.
🔥 Trade Plan – Bullish Strategy in Play
✅ Technical Confirmation
KIJUN MA accumulation indicates steady buy-side pressure building beneath price.
HULL Moving Average breakout completed with a clean pullback + retest, confirming trend continuation strength.
Market structure remains constructive with higher lows forming consistently.
🎯 Entry Plan (Layering Method Included)
Any price level can be used, but this plan uses Thief Layering Strategy for controlled scaling:
💠 Buy Limit Layers:
47,000
47,250
47,500
47,750
48,000
(Traders can add more layers depending on personal risk and capital allocation style.)
🛡️ Stop Loss (SL)
Thief SL → 46,750
Dear Ladies & Gentlemen (Thief OGs): Please adjust according to personal strategy and risk. This SL is an example, not a fixed rule. Trade with your own management principles.
🎯 Target (TP)
Main Target → 49,500
The market is approaching major moving-average resistance + overbought zones + potential trap regions. It’s wise to secure profits as the index reaches upper supply levels.
Again, Ladies & Gentlemen (Thief OGs): TP is flexible. Manage your profit bookings based on your personal approach.
🌍 Related Pairs to Watch & Correlations
1️⃣ SPX / S&P 500
Often moves in high correlation with US30.
Strong bullish momentum here typically supports US30 upside.
Watch for divergence → if SPX stalls while US30 pushes, upside may weaken.
2️⃣ NDX / NAS100 (Nasdaq 100)
Tracks tech sentiment, which influences overall US risk appetite.
If NAS100 shows weakness while Dow is rising, expect mixed flows → Dow may slow down but still hold structure.
3️⃣ VIX (Volatility Index)
Inverse correlation to US30.
Falling VIX = stronger risk-on behavior, supporting bullish Dow positions.
Sudden VIX spikes signal caution on existing long positions.
4️⃣ DXY (US Dollar Index)
Strong Dollar sometimes suppresses equity momentum.
If DXY drops, US30 tends to gain strength as liquidity flows to equities.
5️⃣ YM1! (Dow Futures)
The closest real-time mirror of US30 price action.
Useful for re-entry timing during pullbacks and session gaps.
🧭 Final Notes
Stay disciplined with your own SL/TP logic, manage exposure through layered entries, and monitor correlation assets for confirmation. This is a flexible play designed for DAY & Swing traders who thrive in momentum-driven environments.
🏛️ Market Context
The index is showing strong accumulation pressure, with buyers stepping back in as volatility narrows. Momentum tools and trend metrics continue to lean toward the upside, creating a setup where disciplined layering becomes highly effective for precision entries.
🔥 Trade Plan – Bullish Strategy in Play
✅ Technical Confirmation
KIJUN MA accumulation indicates steady buy-side pressure building beneath price.
HULL Moving Average breakout completed with a clean pullback + retest, confirming trend continuation strength.
Market structure remains constructive with higher lows forming consistently.
🎯 Entry Plan (Layering Method Included)
Any price level can be used, but this plan uses Thief Layering Strategy for controlled scaling:
💠 Buy Limit Layers:
47,000
47,250
47,500
47,750
48,000
(Traders can add more layers depending on personal risk and capital allocation style.)
🛡️ Stop Loss (SL)
Thief SL → 46,750
Dear Ladies & Gentlemen (Thief OGs): Please adjust according to personal strategy and risk. This SL is an example, not a fixed rule. Trade with your own management principles.
🎯 Target (TP)
Main Target → 49,500
The market is approaching major moving-average resistance + overbought zones + potential trap regions. It’s wise to secure profits as the index reaches upper supply levels.
Again, Ladies & Gentlemen (Thief OGs): TP is flexible. Manage your profit bookings based on your personal approach.
🌍 Related Pairs to Watch & Correlations
1️⃣
Often moves in high correlation with US30.
Strong bullish momentum here typically supports US30 upside.
Watch for divergence → if SPX stalls while US30 pushes, upside may weaken.
2️⃣
Tracks tech sentiment, which influences overall US risk appetite.
If NAS100 shows weakness while Dow is rising, expect mixed flows → Dow may slow down but still hold structure.
3️⃣
Inverse correlation to US30.
Falling VIX = stronger risk-on behavior, supporting bullish Dow positions.
Sudden VIX spikes signal caution on existing long positions.
4️⃣
Strong Dollar sometimes suppresses equity momentum.
If DXY drops, US30 tends to gain strength as liquidity flows to equities.
5️⃣
The closest real-time mirror of US30 price action.
Useful for re-entry timing during pullbacks and session gaps.
🧭 Final Notes
Stay disciplined with your own SL/TP logic, manage exposure through layered entries, and monitor correlation assets for confirmation. This is a flexible play designed for DAY & Swing traders who thrive in momentum-driven environments.
💰 Money-Making Analysis
• Forex💹
• Indices📈
• Crypto ₿
• Commodities⚡
• Stocks🏦
• Fundamental + Macro📊
• Sentiment🔎
👉 Ask what analysis you need & get it FREE!
Join Discord for signals + data & grab the Master Plan: discord.gg/ZQS3y7FhVr
• Forex💹
• Indices📈
• Crypto ₿
• Commodities⚡
• Stocks🏦
• Fundamental + Macro📊
• Sentiment🔎
👉 Ask what analysis you need & get it FREE!
Join Discord for signals + data & grab the Master Plan: discord.gg/ZQS3y7FhVr
การนำเสนอที่เกี่ยวข้อง
คำจำกัดสิทธิ์ความรับผิดชอบ
ข้อมูลและบทความไม่ได้มีวัตถุประสงค์เพื่อก่อให้เกิดกิจกรรมทางการเงิน, การลงทุน, การซื้อขาย, ข้อเสนอแนะ หรือคำแนะนำประเภทอื่น ๆ ที่ให้หรือรับรองโดย TradingView อ่านเพิ่มเติมใน ข้อกำหนดการใช้งาน