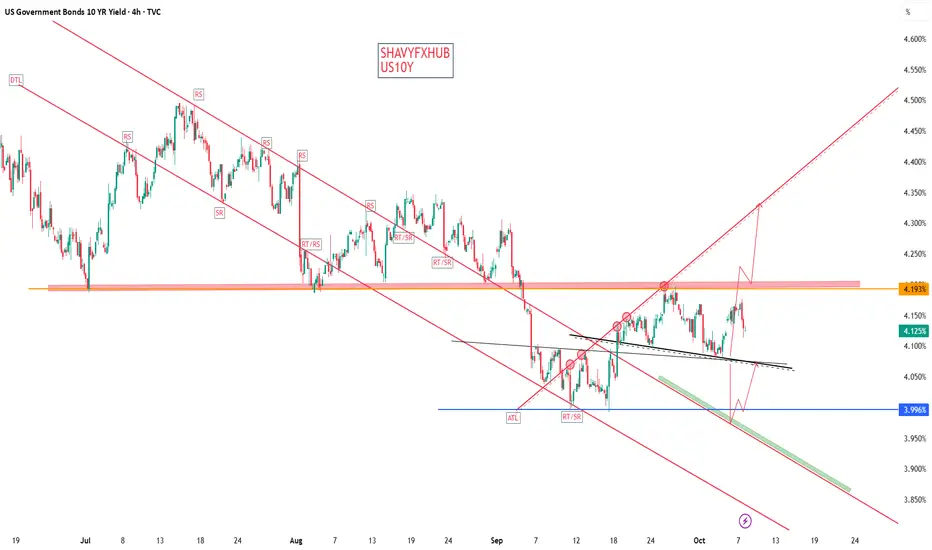
US10Y TECHNICAL DETAILS
4.193% A KEY RESISTANCE TO UPSWING
4.088% DEFENDED SUPPORT CURRENTLY
3.996 % LOW RECOVERED AND TESTED TWICE.ANY ATTEMPT ON THIS ZONE WILL BE A TECHNICAL DOWNSLIDE.
The US 10-year Treasury yield is approximately 4.125%
This yield represents the return investors expect for lending to the US government for 10 years and is a key benchmark influencing financial markets.
Dollar Index (DXY)
The DXY measures the value of the US dollar relative to a basket of major currencies , reflecting the dollar's strength amid global economic conditions such as interest rate differentials and geopolitical factors.
Relationship Between US10Y and DXY
The US10Y yield strongly influences the DXY because higher yields attract foreign capital, boosting demand for the dollar and strengthening the index.
When yields rise, the DXY usually follows upward due to investor demand for higher-yielding dollar assets.
Conversely, yields falling can weaken the dollar, reducing the DXY.
The relationship between bond yield and bond price is fundamental in bond investing and is characterized by an inverse correlation:
Key Concepts
Bond Price: The amount investors are willing to pay for a bond in the market. This can be above or below the bond’s face/par value.
Bond Yield: The return an investor expects to earn if the bond is held until maturity, expressed as a percentage. Several types include coupon rate, current yield, and yield to maturity (YTM).
Relationship Between Bond Yield and Bond Price
Inverse Relationship: When bond prices go up, bond yields go down; when bond prices fall, bond yields rise. This is because the fixed coupon payment represents a smaller or larger percentage of the bond’s market price depending on price changes.
Why? If interest rates in the market rise, new bonds offer higher yields. Existing bonds with lower coupons become less attractive, so their prices drop to increase their yield to competitiveness. Conversely, if market interest rates fall, existing bonds with higher coupons become more valuable, driving prices up and yields down.
Basic Formula Explanation
Current Yield = Annual Coupon Payment / Current Bond Price
Example:
A bond with a $1,000 face value and $50 annual coupon pays a 5% coupon rate.
If the bond price drops to $900, the current yield = $50 / $900 ≈ 5.56% (yield rises)
If the bond price rises to $1,100, the current yield = $50 / $1,100 ≈ 4.55% (yield falls)
More Accurate Measure: Yield to Maturity (YTM)
YTM accounts for the total return, including coupon payments and the gain or loss if the bond is held to maturity.
It reflects the discount rate that equates the present value of a bond’s cash flows (coupons + principal repayment) to its current market price.
Summary
Change Direction Effect on Bond Price and Yield
Interest Rates Rise Bond prices fall, bond yields rise
Interest Rates Fall Bond prices rise, bond yields fall
Bond Price Increases Bond yield decreases
Bond Price Decreases Bond yield increases
Bond investors must understand this inverse dynamic to manage portfolio risks and returns effectively.
NOTE ;IF YOU ARE A GOLD TRADER FOCUS ON DXY AND US10Y PRICE ACTION
#US10Y #BONDS #DXY #DOLLAR
คำจำกัดสิทธิ์ความรับผิดชอบ
ข้อมูลและบทความไม่ได้มีวัตถุประสงค์เพื่อก่อให้เกิดกิจกรรมทางการเงิน, การลงทุน, การซื้อขาย, ข้อเสนอแนะ หรือคำแนะนำประเภทอื่น ๆ ที่ให้หรือรับรองโดย TradingView อ่านเพิ่มเติมที่ ข้อกำหนดการใช้งาน
คำจำกัดสิทธิ์ความรับผิดชอบ
ข้อมูลและบทความไม่ได้มีวัตถุประสงค์เพื่อก่อให้เกิดกิจกรรมทางการเงิน, การลงทุน, การซื้อขาย, ข้อเสนอแนะ หรือคำแนะนำประเภทอื่น ๆ ที่ให้หรือรับรองโดย TradingView อ่านเพิ่มเติมที่ ข้อกำหนดการใช้งาน