NASDAQ Correction for few days then buy the dip
Nasdaq (NDX) has gone a long way since we called for a rebound on the 1D MA200:

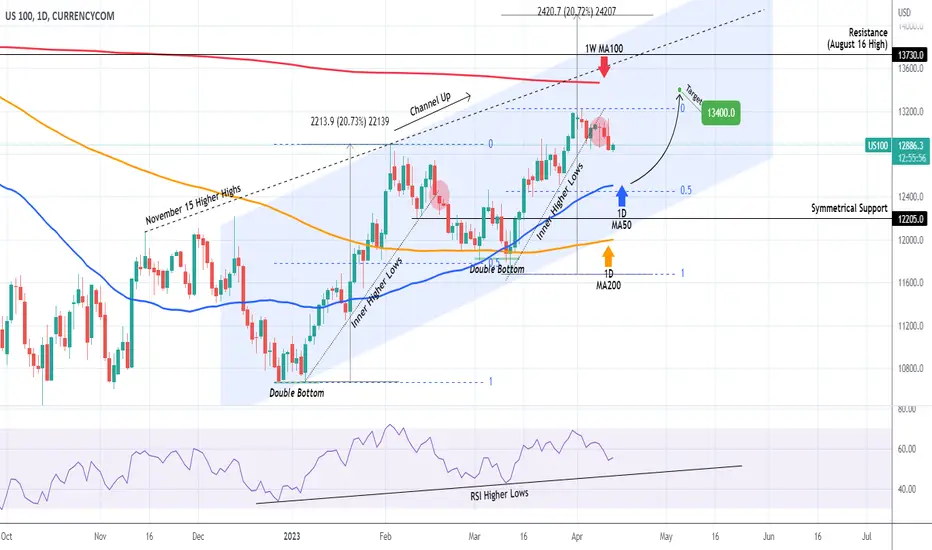
The recent rally within this Channel Up pattern that started in December (its second Bullish Wave), came to an end after it broke the Inner Higher Lows trend-line in similar fashion as the first wave did on February 17. That pulled-back to the 0.5 Fibonacci retracement level before rebounding to a Higher High.
The current 0.5 Fib is on 12460, a little under the March 28 Low and the 1D MA50 (blue trend-line), which has been basically supporting since mid-January. If the RSI bounces off its Higher Lows trend-line, then the bottom may come earlier. In any case, we will buy this pull-back and target 13400, a potential contact with the 1W MA100 (red trend-line), which rejected the August 16 High.
The best level to buy during this run is on the Higher Lows trend-line of the RSI. A similar Higher Lows trend-line during the January bullish leg (note that both sequences started on a Double Bottom), gave 5 clear buy entries.
-------------------------------------------------------------------------------
** Please LIKE 👍, FOLLOW ✅, SHARE 🙌 and COMMENT ✍ if you enjoy this idea! Also share your ideas and charts in the comments section below! **
-------------------------------------------------------------------------------
💸💸💸💸💸💸
👇 👇 👇 👇 👇 👇
👑Best Signals (Forex/Crypto+70% accuracy) & Account Management (+20% profit/month on 10k accounts)
💰Free Channel t.me/tradingshotglobal
🤵Contact info@tradingshot.com t.me/tradingshot
🔥New service: next X100 crypto GEMS!
💰Free Channel t.me/tradingshotglobal
🤵Contact info@tradingshot.com t.me/tradingshot
🔥New service: next X100 crypto GEMS!
คำจำกัดสิทธิ์ความรับผิดชอบ
ข้อมูลและบทความไม่ได้มีวัตถุประสงค์เพื่อก่อให้เกิดกิจกรรมทางการเงิน, การลงทุน, การซื้อขาย, ข้อเสนอแนะ หรือคำแนะนำประเภทอื่น ๆ ที่ให้หรือรับรองโดย TradingView อ่านเพิ่มเติมที่ ข้อกำหนดการใช้งาน